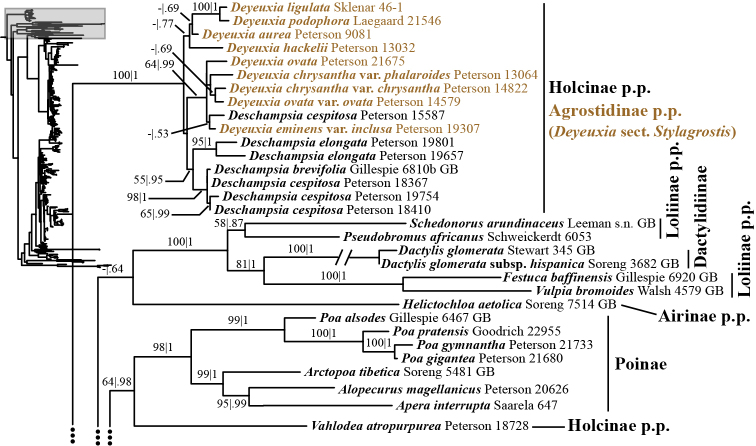
Figure 4.
A portion (Holcinae p.p., Agrostidinae p.p., Loliinae, Dactylidinae and Poinae) of the maximum likelihood phylogram inferred from ITS+ETS data. ML bootstrap support (left) and BI poster probabilities (right) are recorded along branches. A dash indicates bootstrap support <50%. No support is shown for branches with bootstrap support <50% and posterior probability <.5. The shaded area of the smaller tree on the left indicates the location in the overall tree of the portion shown. The branch subtending Dactylidinae, with double slashes, is shortened for presentation. Backbone branches represented by ellipses are shown only in Figure 1.

