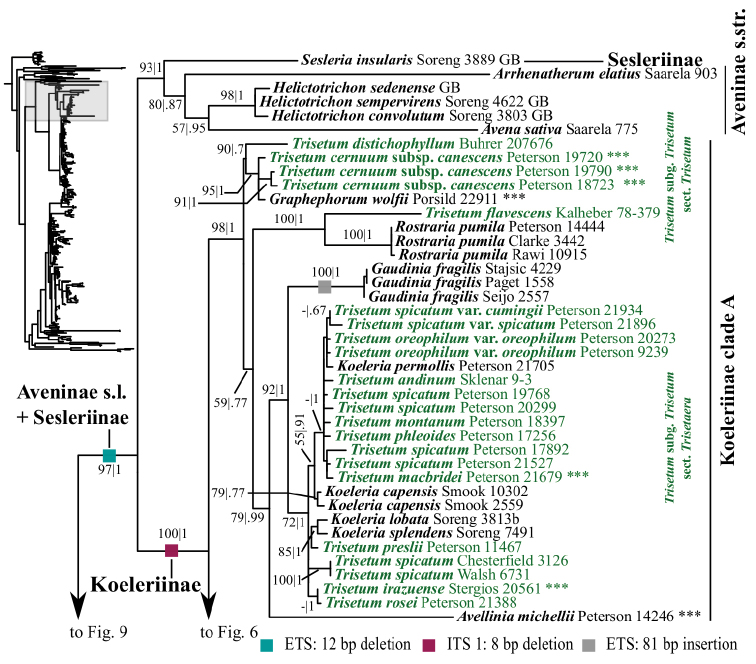
Figure 5.
A portion (Sesleriinae, Aveninae s.str., Koeleriinae clade A) of the maximum likelihood phylogram inferred from ITS+ETS data. ML bootstrap support (left) and BI poster probabilities (right) are recorded along branches. A dash indicates bootstrap support <50%. No support is shown for branches with bootstrap support <50% and posterior probability <.5. The shaded area of the smaller tree on the left indicates the location in the overall tree of the portion shown. Placements of samples with asterisks (***) are incongruent in nrDNA and plastid trees. Two indels in ETS and one in ITS are mapped onto the phylogram.

