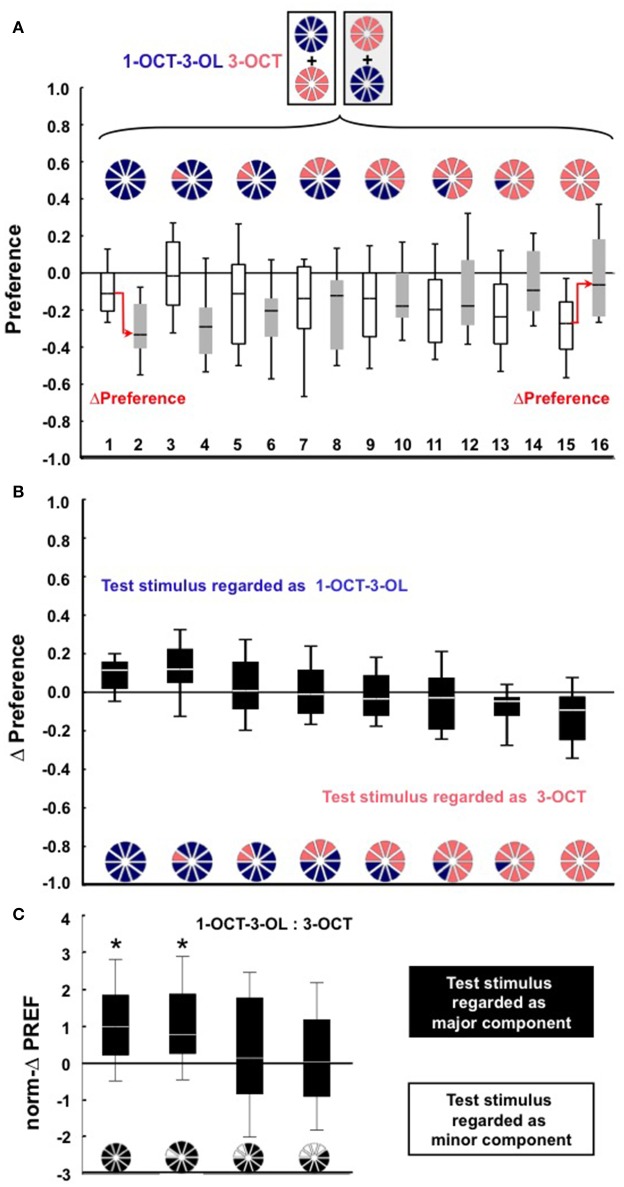
Figure 2.
(A–C) Same as in Figure 1 for the odor pair 1-OCT-3-OL and 3-OCT. In (A) Ns are 19, 19, 18, 18, 18, 18, 18, 18, 19, 19, 18, 18, 21, 21, 19, 19 from left to right. ΔPreference scores are displayed in (B). Data in (C) differ across groups (KW-test, P < 0.05, H = 11.83, df = 3); asterisks above the box plots indicate P < 0.05/4 in W-tests for the norm-ΔPREF scores.

