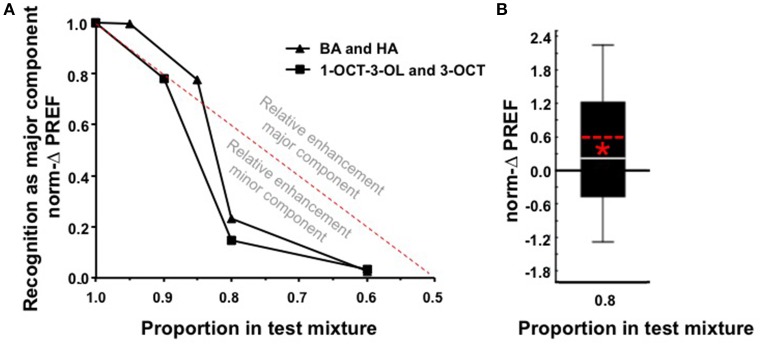
Figure 3.
(A) Medians of the norm-ΔPREF scores from Figures 1C, 2C, plotted against the mixture ratio. This illustrates that the impact of the major component is less than one would expect if it were linearly based on the proportion of the mixture components (red stippled line: Y = 2X + [−1]). In other words, scores above the red stippled line indicate an enhanced impact of the major component, whereas scores below the red stippled line indicate enhancement of the impact of the minor component, relative to such a linear expectation. A test across the complete dataset represented here by the medians reveals that scores are consistently smaller than this expectation (W-test, P < 0.05, N = 312) (for the 1.0 case the median norm-ΔPREF score equals 1 by definition, such that they cannot be included in this analysis). Please note that, because for the 0.5 case we used an arbitrary convention as to whether the norm-ΔPREF scores were positive or negative (see Materials and Methods section), the respective points of the functions had to be omitted from this plot. (B) Pooled norm-ΔPREF scores for both odor pairs statistically tested against the linear expectation (i.e., norm-ΔPREF = 0.6, red stippled line) for a mixture with a 0.8 proportion of the major component. *P < 0.05 in a W-test, N = 116.

