
Figure 4.
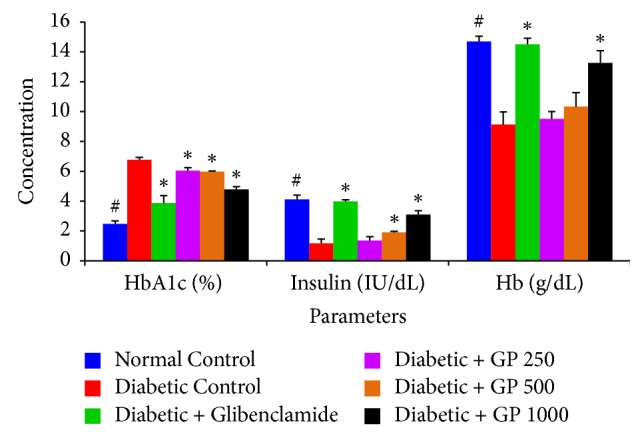
The effects of GP fruit extract and glibenclamide on insulin, HbA1c, and Hb levels in normal and STZ-induced diabetic rats. Data are represented as the mean ± SD (n = 8). ∗ denotes a significant difference (p < 0.05) between the treatment groups and the diabetic control group. # denotes a significant difference (p < 0.05) when the normal control group was compared to the diabetic control group. The comparisons were made by one-way ANOVA followed by Dunnett's multiple comparison test.