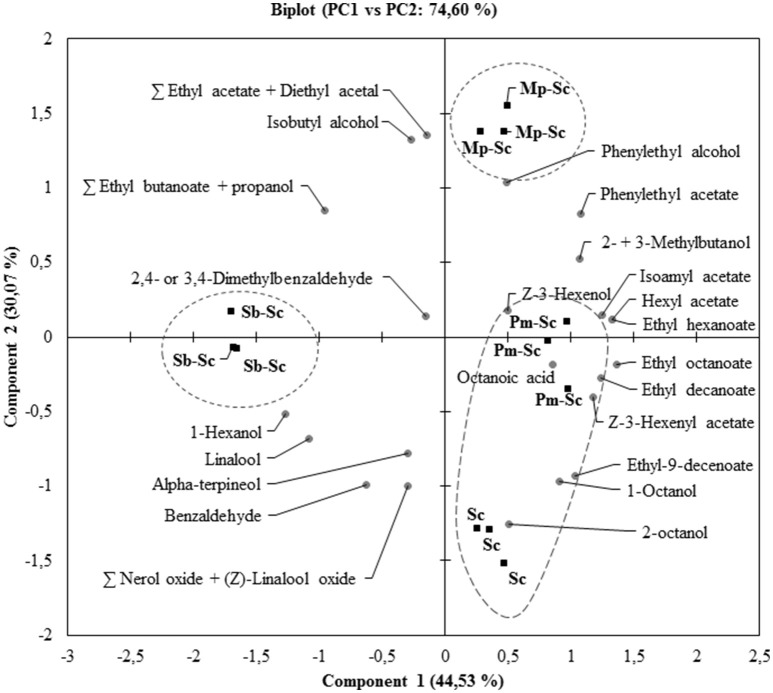
Figure 5.
Biplot of the principal component analysis (PC1 vs. PC2) for volatile compounds (A) from sequential fermentations: S. bacillaris BBMV5FA17—S. cerevisiae SLM (Sb–Sc), M. pulcherrima BB810—S. cerevisiae SLM (Mp–Sc), P. membranifaciens BB3—S. cerevisiae SLM (Pm–Sc) at 20°C. S. cerevisiae SLM (Sc) in pure culture was used as a control. Ellipses represent clusters obtained from HCA.

