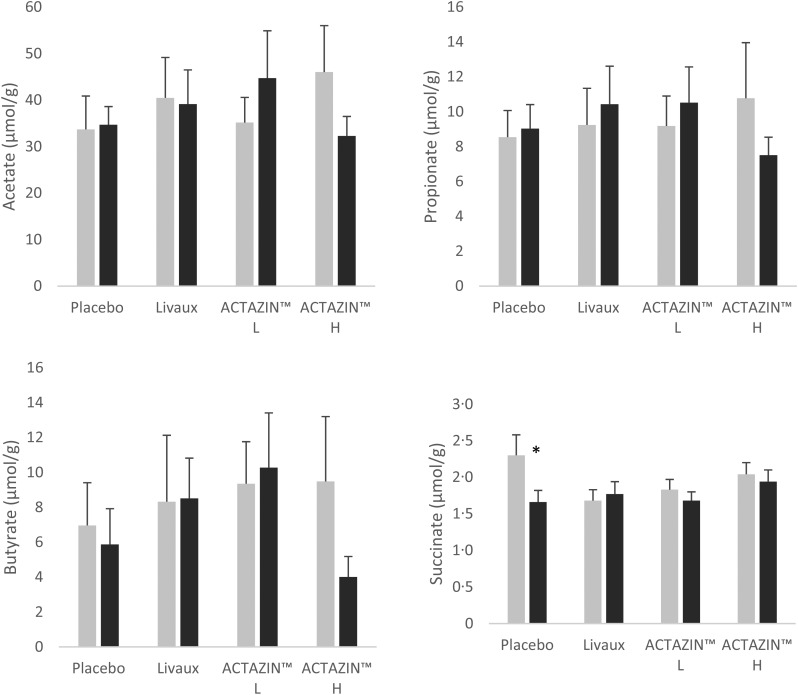
Fig. 3.
Organic acid concentrations in faecal samples in response to the four treatments in the functionally constipated group as measured by GC, expressed in μmol/g faeces. ░, Pre-treatment; ■, after treatment; L, low dose; H, high dose. Values are means, with standard errors represented by vertical bars. * Significantly different compared with pre-treatment based on the Wilcoxon signed rank test after false discovery rate correction for multiple comparisons (P ≤ 0·05).

