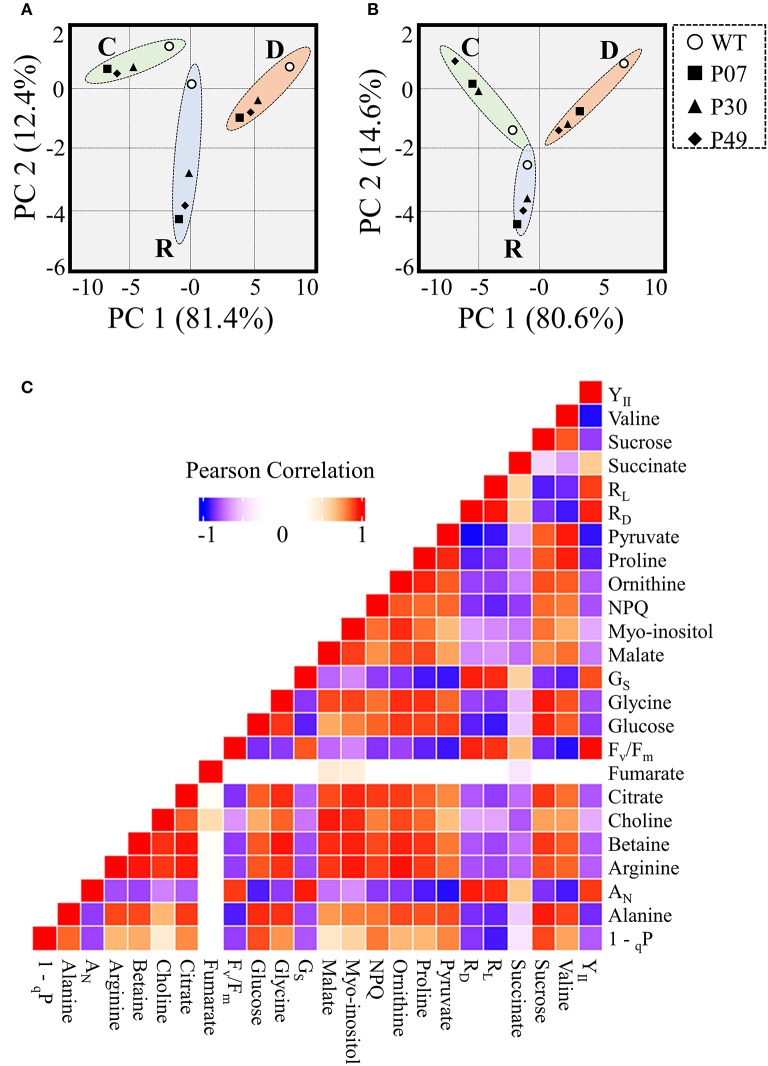
Figure 10.
Data integration of metabolomics combined with physiological parameters of WT and transgenic lines. Principle component analysis (PCA) scores plot representation of (A) metabolomics or (B) metabolomics combined with physiological parameters from WT and transgenic lines (P07, P30, and P49). Dashed lines represent 95% confidence intervals for well-watered (C), drought (D), and recovery (R) conditions. (C) Pearson correlation analysis of metabolomics combined with physiological parameters.

