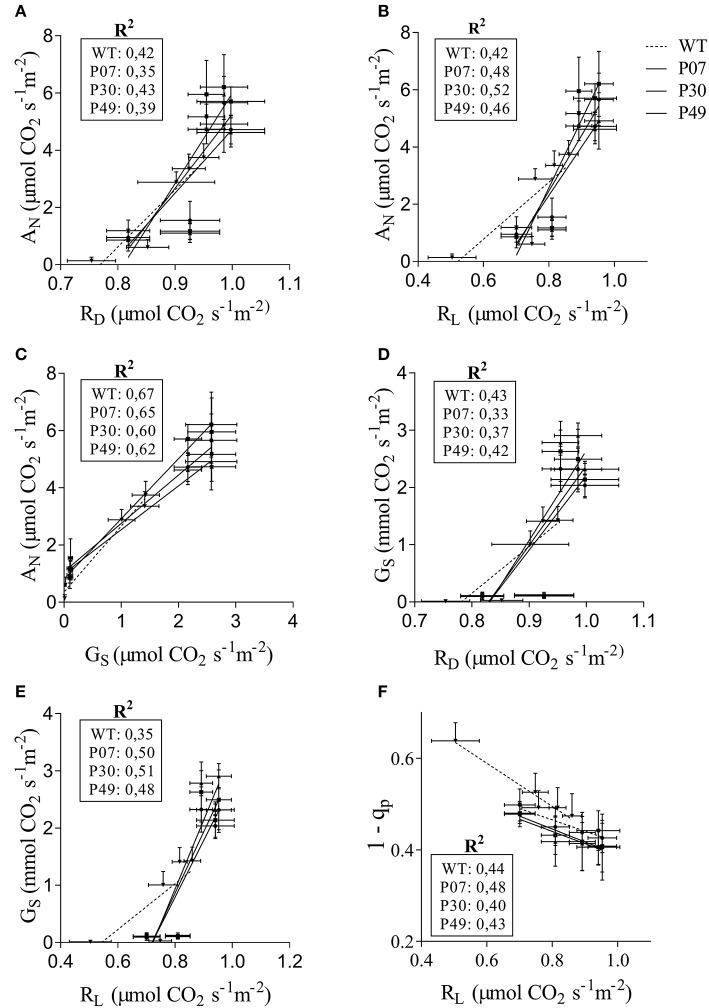
Figure 3.
Correlation of physiological parameters in WT and transgenic lines. The relationships of (A) RD, (B) RL, and (C) GS with AN was determined for WT (dashed line) and transgenic lines (plain lines). (D,E) GS as a function of RD and RL, respectively. (F) 1-qP as a function of RL. The curves were calculated for each line individually. Control, drought and recovery data were pooled together for the linear regression analysis.

