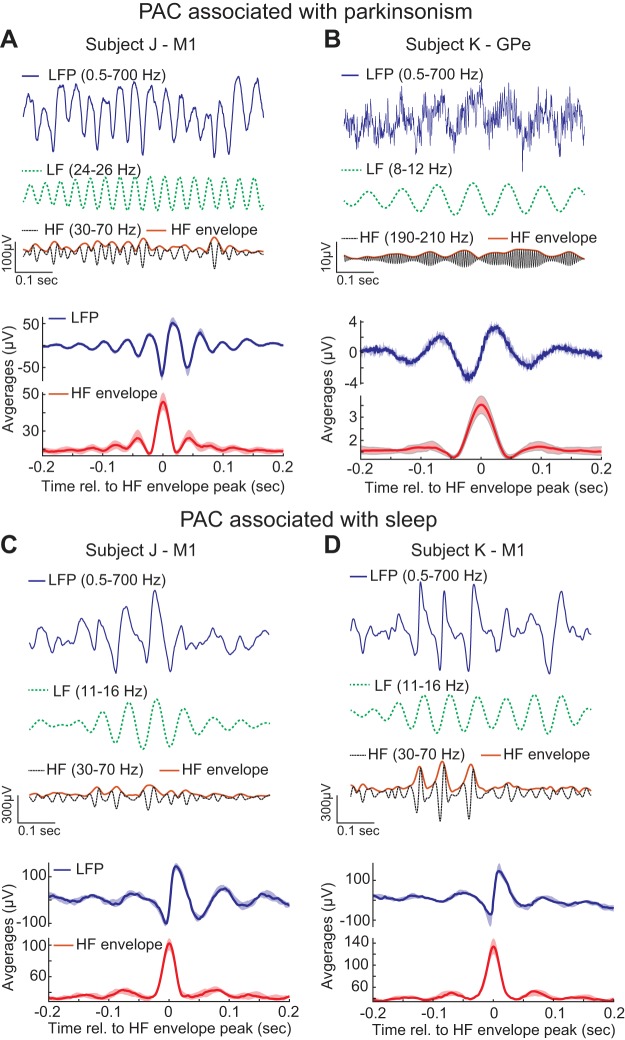
Fig. 7.
Local field potential (LFP) signal morphologies associated with PAC measurements related to parkinsonism in the M1 of subject J (A) and GPe of subject K (B) as well as sleep in the M1 of subject J (C) and M1 of subject K (D). Raw LFP traces and their low- (LF) and high-frequency (HF) filtered components are shown from a selected recording session during periods with elevated PAC measurements along with amplitude-triggered averages of LFPs calculated from all data sets. The amplitude-triggered averages illustrate the shape of the LFP signal relative to the local maxima in the HF envelope (median and interquartile range shown).

