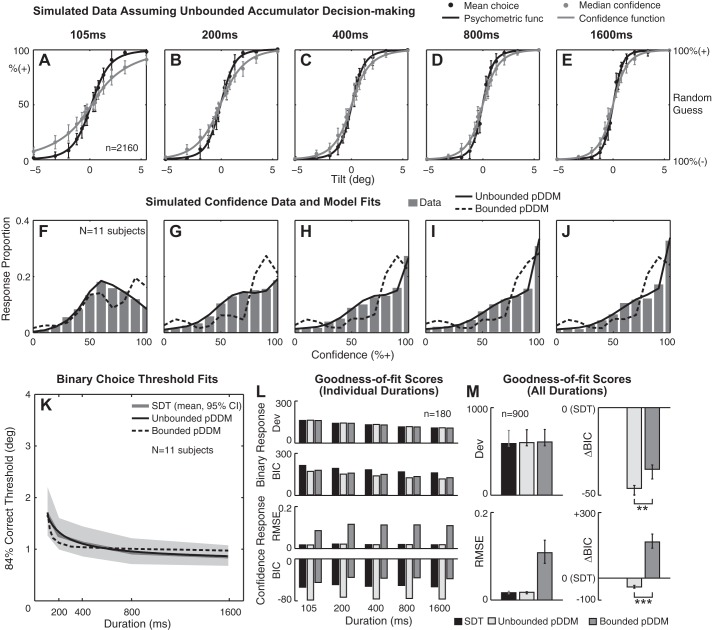
Fig. 6.
Simulated data set generated by an unbounded pDDM. A–E: a Gaussian psychometric function (solid black curve) was fitted to simulated binary choice data (black circles), and a Gaussian confidence function (solid gray curve) was fitted to simulated confidence data (gray circles) at individual stimulus durations. Twelve virtual subjects were simulated, yielding 2,160 data points per duration. x-Axis is stimulus level in tilt. Left y-axis is % responding + in case of binary response and % confidence that the stimulus is + in case of confidence response. Right y-axis shows the confidence interpreted by subjects (% correct). F–J: confidence histograms aggregated across all stimulus levels for 11 simulated subjects that yielded converging fits for both unbounded and bounded models. K: binary choice threshold estimates as a function of stimulus duration. Unbounded pDDM, bounded pDDM, and signal detection theory (SDT) threshold predictions were averaged across 11 simulated subjects. Gray shading shows 95% CI for SDT fit. L: mean goodness-of-fit scores at individual stimulus duration for binary responses (top) and confidence responses (bottom). M: marginal goodness-of-fit scores across all durations for binary responses (top) and confidence responses (bottom). Horizontal bars: **strong (ΔBICBounded − Unbounded > 6) support, ***very strong support (ΔBICBounded − Unbounded > 10) for unbounded pDDM. Error bars show lower and upper quartiles.

