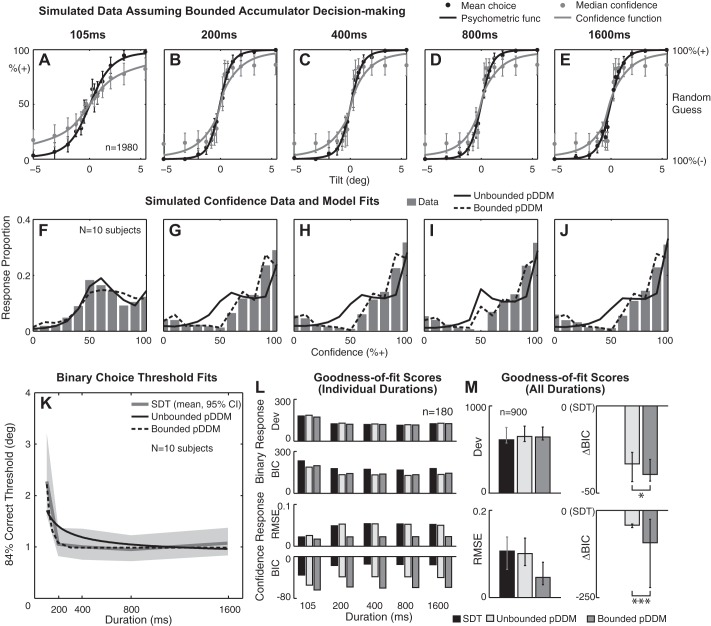
Fig. 7.
Simulated data set generated by a bounded pDDM. A–E: a Gaussian psychometric function (solid black curve) was fitted to simulated binary choice data (black circles), and a Gaussian confidence function (solid gray curve) was fitted to simulated confidence data (gray circles) at individual stimulus durations. Eleven virtual subjects with converging bounded model fits were simulated, yielding 1,980 data points per duration. x-Axis is stimulus level in tilt. Left y-axis is % responding + in case of binary response and % confidence that the stimulus is + in case of confidence response. Right y-axis shows the confidence interpreted by subjects (%correct). F–J: confidence histograms aggregated across all stimulus levels for 10 simulated subjects that yielded converging fits for both unbounded and bounded models. K: binary choice threshold estimates as a function of stimulus duration. Unbounded pDDM, bounded pDDM, and signal detection theory (SDT) threshold predictions were averaged across 10 simulated subjects. Gray shading shows 95% CI for SDT fit. L: mean goodness-of-fit scores at individual stimulus duration for binary responses (top) and confidence responses (bottom). M: marginal goodness-of-fit scores across all durations for binary responses (top) and confidence responses (bottom). Horizontal bars: *positive evidence (ΔBICBounded − Unbounded > 2), ***very strong evidence (ΔBICBounded − Unbounded > 10) for bounded pDDM. These results are the opposite of the analysis from the real experimental data. Error bars show lower and upper quartiles.

