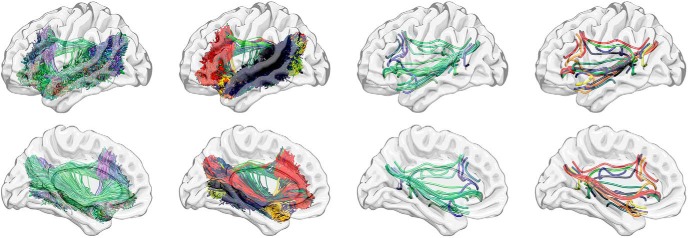
Figure 3.
The connectivity weight analyses focused on a subnetwork of the whole brain connectome composed of all 28 unique possible connections between the eight language-specific ROIs. Each connection was independently assessed and their anatomic representations (in a cohort of healthy individuals; see Materials and Methods for details) are demonstrated in this figure. All deterministic streamlines are represented in the first column (colored in accordance with their main direction of displacement, as per tractography convention: red, lateral to lateral; blue, rostral to caudal; green, anterior to posterior). Each specific pair-wise connection is represented by a different color in the second column. The third column demonstrates the centers of mass (centroids) of each pair-wise connection (colored per tractography convention), and the fourth column demonstrates each connection centroid colored similarly to the second column. Note the comprehensive and intricate pattern of structural connectivity assessed in the connectivity weight analyses.

