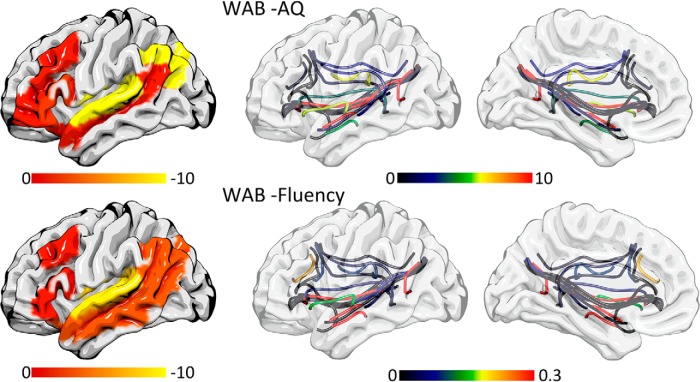
Figure 7.
The individual coefficients are shown in color to illustrate which ROIs were more influential on the ROI model (left column) and which connections were more influential on the connectivity weights model (right most columns) for predicting WAB-AQ (first row) and WAB fluency (second row). The color bars indicate SVR coefficients.

