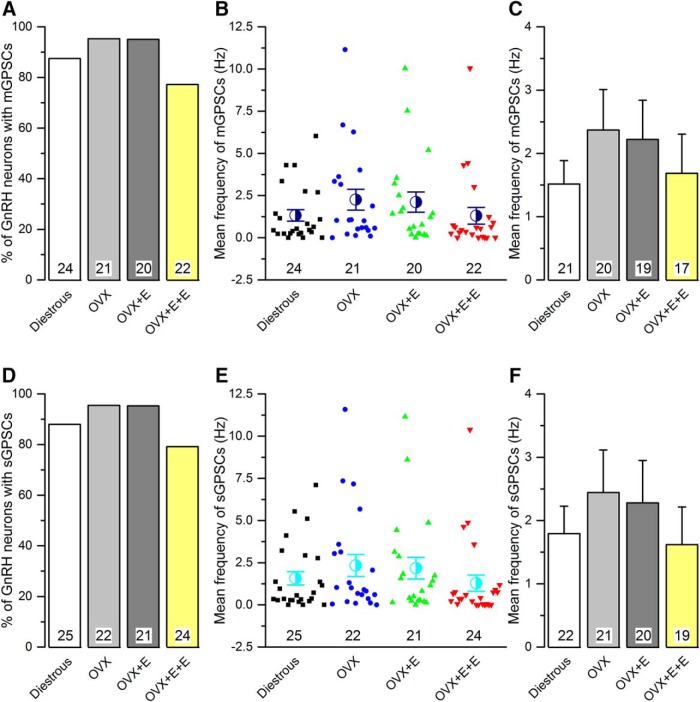
Figure 2.
The frequency of miniature (mGPSC) and spontaneous (sGPSC) GABAA receptor PSCs recorded from GnRH neurons do not change in the different mouse models of estrogen negative and positive feedback. A, D, Histograms showing the percentage of GnRH neurons exhibiting mGPSCs (A) or sGPSCs (D) in each group. B, E, Scatter plots showing the individual and mean (±SEM) frequency of mGPSCs (B) or sGPSCs (E) in all GnRH neurons of the four experimental groups. C, F, Histograms showing the mean frequency of mGPSCs (C) or sGPSCs (F) from only those cells exhibiting mGPSCs (C) or GPSCs (F) in each animal group. Numbers at the base show the cell number. The animal number is seven for each group. No statistically significant differences were detected for any parameter between the different groups.

