Figure 1.
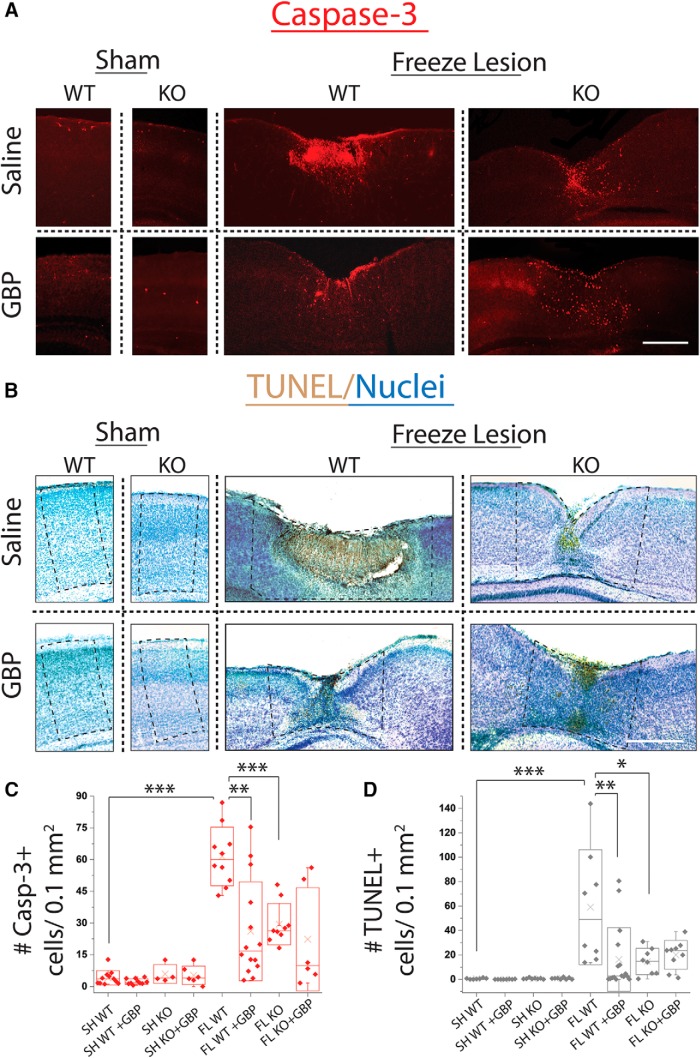
GBP treatment or α2δ-1 deletion decreases cell death following FL. A, Representative images of cleaved caspase-3 (casp-3) staining in P7 WT and α2δ-1−/− sham ±GBP and WT and α2δ-1−/− FL ±GBP. Scale bar = 500 µm. B, Representative bright-field images of TUNEL assay (TUNEL+ cells stained brown by DAB, nuclei counterstained by methyl green) in P7 WT and α2δ-1−/−(KO) sham ±GBP and WT and α2δ-1−/− FL ±GBP. Scale bar = 500 µm. Approximate ROI for analysis shown in dashed box. C, Box-whisker plot of casp-3+ cells per 0.1 mm2, **α = 0.01 and ***α = 0.001 (Holm-Bonferroni multiple-comparison correction). D, Box-whisker plot of TUNEL+ cells per section, *α = 0.05, **α = 0.01, and ***α = 0.001 (Holm-Bonferroni multiple-comparison correction).

