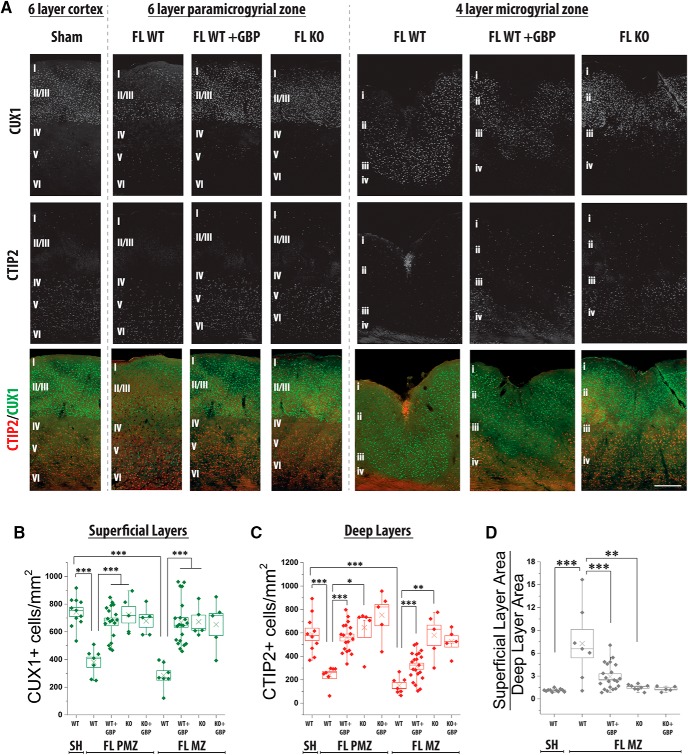
Figure 3.
GBP treatment or α2δ-1 KO attenuates the loss of layer-specific markers in the FL cortex. A, Representative images of CUX1 (green) and CTIP2 (red) staining in P28 WT sham cortex and the PMZ and MZ of WT FL, WT FL + GBP, and α2δ-1−/− (KO) FL cortex. Scale bar = 250 µm. B, Box-whisker plot of CUX1+ cells per mm2 in the outer layers, ***α = 0.001 (Holm-Bonferroni multiple-comparison correction). C, Box-whisker plot of CTIP2+ cells per mm2 in the deep layers, ***α = 0.001, **α = 0.01, and *α = 0.05 (Holm-Bonferroni multiple-comparison correction). D, Box-whisker plot of ratio of area of outer layer (Layer II/III in sham and layer ii in FL) to area of inner layer (Layer V and VI in sham and layer iv in FL) in sham, FL, FL + GBP, and α2δ-1 KO FL cortex, ***α = 0.001 and **α = 0.01 (Holm-Bonferroni multiple-comparison correction).

