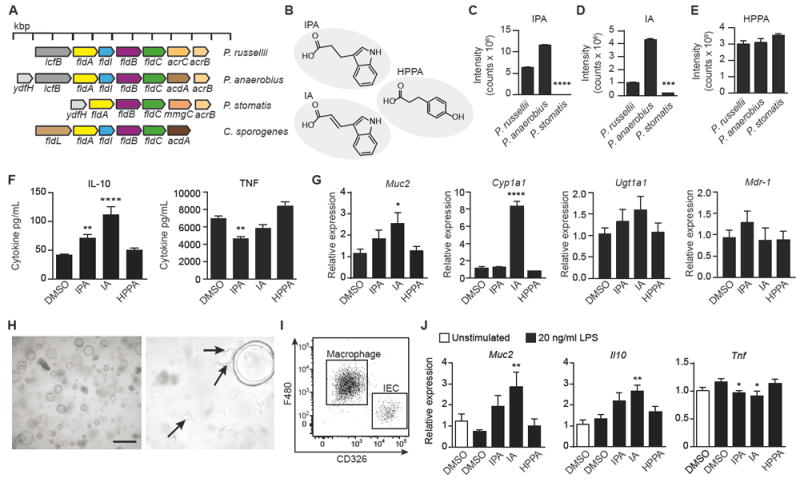
Figure 4. IPA and IA are produced by some Peptostreptococcus species and IA exhibits anti-inflammatory effects.

(A) Bacterial genomic comparison showing phenyllactate operon in Peptostreptococcus species compared to a previously identified operon in C. sporogenes.
(B) MS QTOF analysis of culture supernatant from Peptostreptococcus species identified tryptophan metabolites (IPA, indole-3-propionic acid; IA, indoleacrylic acid) and a phenylalanine metabolite (HPPA, 3-hydroxyphenyl propionic acid).
(C-E) Ion chromatograms extracted at m/z and retention times of IPA (C), IA (D), and HPPA (E) were used to determine the relative abundance of each metabolite produced by 3 indicated strains. See also Figure S3A-S3C. ****P < 0.0001, ***P = 0.0003. Data representative of 3 experiments and expressed as mean + SEM.
(F) Isolated and cultured BMDMs were treated with 100 μM of each metabolite or 0.1% DMSO control for 6 h, followed by 24 h of IL-4 conditioning, and then stimulated with 20 ng/mL LPS for 18 h. Supernatants were analyzed for IL-10 (IPA, **P = 0.0032; IA, ****P = 0.0001) and TNF (**P = 0.004) production. Data pooled from 4 independent experiments.
(G) Quantitative RT-PCR showing expression of Muc2 (*P = 0.0263), the AhR target gene Cyp1a1 (****P = 0.0001), and the PXR target genes, Ugt1a1 and MDR-1, relative to Actb and compared to 0.1% DMSO control. Data pooled from 2 independent experiments using 4-5 independent colonic spheroid lines.
(H) Representative light phase image of large intestinal spheroids co-cultured with macrophages in Matrigel at 5X (left) and 40X (right) magnification. Arrows indicate macrophages with extended pseudopods.
(I) Representative flow cytometry dot plot of F480+ macrophages and CD326+ epithelial cells in the co-culture system indicating the percentage of macrophages (80.0 ± 4.3%) and epithelial cells (16.0 ± 4.5%) after 3 days of co-culture, expressed as mean ± SD.
(J) Quantitative RT-PCR showing expression of Muc2 (**P = 0.0077), Il10 (**P = 0.0072), and Tnf (*P = 0.0477 for IPA; *P = 0.0148 for IA) in co-culture of large intestinal spheroids and BMDMs after 48 h of treatment with 100 μM IPA, IA, HPPA, or 0.1% DMSO control followed by 20 ng/mL LPS stimulation for 24 h. Data are pooled from 2 independent experiments using 4-5 independent colonic spheroid lines. Significance determined using one-way ANOVA with Fisher’s LSD test and expressed as mean + SEM.
See also Figures S3-S4.
