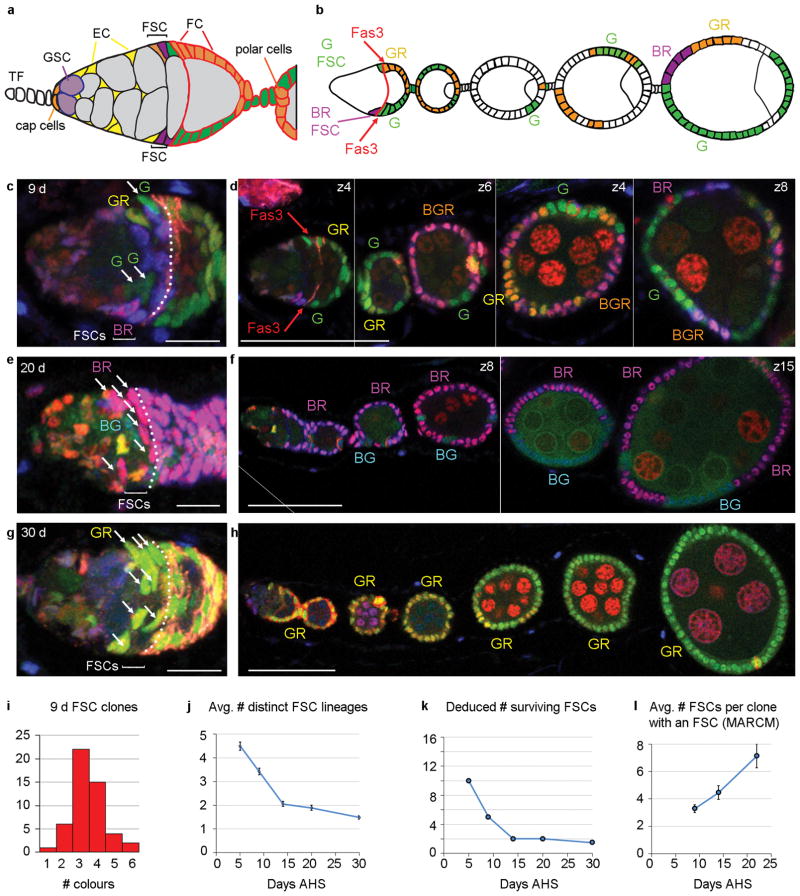
Figure 2. FSC population asymmetry.
(a,b) Diagram of (a) a germarium and (b) anterior portion of an ovariole illustrating the clones observed in (c,d). There are G (green), BR (purple), GR (orange) and BGR (white in (b)) FSC clones containing at least one candidate FSC in region 2a/b (BGR FSC is in a different z-section) and one FC patch. (c–h) Examples of (d,f,h) ovarioles (single z-sections) and (c,e,g) their germaria (3–5 z-sections combined) at higher magnification from multicolour lineage experiments 9, 20 and 30 days AHS. The number of distinct FSC lineages declines from (c,d) four at 9d to (e,f) two (BG, BR) at 20d and (g,h) just one (GR) at 30d (single-channel images show all cells have GFP and RFP). (c,e,g) The number of FSCs of one colour (white arrows in (c) G, (e) BR and (g) GR) is higher when fewer FSC lineages are present (Fas3 staining enhanced by white dotted line). Scale bars (c,e,g) 10μm, (d,f,h) 50μm. (d,f) Vertical white lines separate different z-sections (indicated top right) for different regions of the ovariole (full original images for each z-section in Supplementary Fig. 9). (f) Diagonal white line indicates an edge of the original image (shown in Supplementary Fig. 9). (i) Number of ovarioles (among 50) with the indicated number of distinct FSC clone colours 9d AHS. (j) Mean number of distinct multicolour FSC lineages observed and (k) deduced number of FSC lineages surviving for indicated number of days after heat-shock (AHS). (j) Error bars show SEM for n=50 (5d), 50 (9d), 53 (14d), 47 (20d) and 60 (30d) biologically independent ovarioles. Mean number of distinct FSC lineages differed significantly by Pearson’s chi-squared test between d5 and d9 (p<0.0005), d9 and d14 (p=1×10⁻⁶), d20 and d30 (p<0.01). The observation of several distinct FSC lineages was not contingent on using multiple heat-shocks for clone induction. An analogous experiment 12d after a single heat-shock produced ovarioles with one (5/45), two (18/45), three (15/45), four (5/45) and five (2/45) FSC clone colours with FSCs in the same locations as described earlier (Supplementary Fig. 3). (l) Mean number of FSCs labeled per MARCM clone at different times AHS. Error bars show SEM for n=151 (9d), 77 (14d) and 112 (22d) biologically independent clones. Mean number of FSC per clone differed significantly by Pearson’s chi-squared test between d9 and d14 (p<0.05), d14 and d22 (p<0.05).

