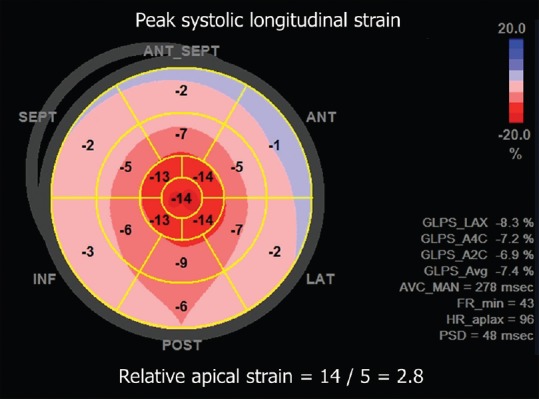
Figure 1.

Color-coded polar diagram obtained by speckle-tracking echocardiography showing the distribution of peak systolic longitudinal strain values throughout the myocardium. There is progressive impairment of longitudinal shortening from the apex (central area, red color) to the basal left ventricular segments (external areas, pink color). This pattern is known as relative apical sparing
