
Figure 1.
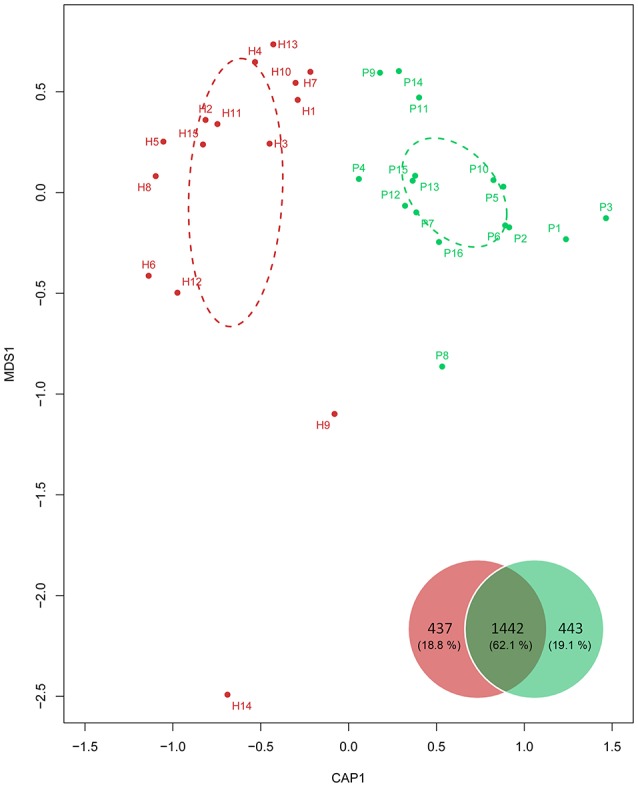
β-diversity comparison using constrained principal coordinate analysis (CAP) of unifrac distance across the 31 individuals. Dashed ellipses were drawn for the confidence areas (confidence limit = 0.95) of the healthy (red) and periodontitis (green) groups. The Venn diagram inset shows the numbers (percentages in all) of OTUs from the healthy (red) and periodontitis groups (green).