Figure 3.
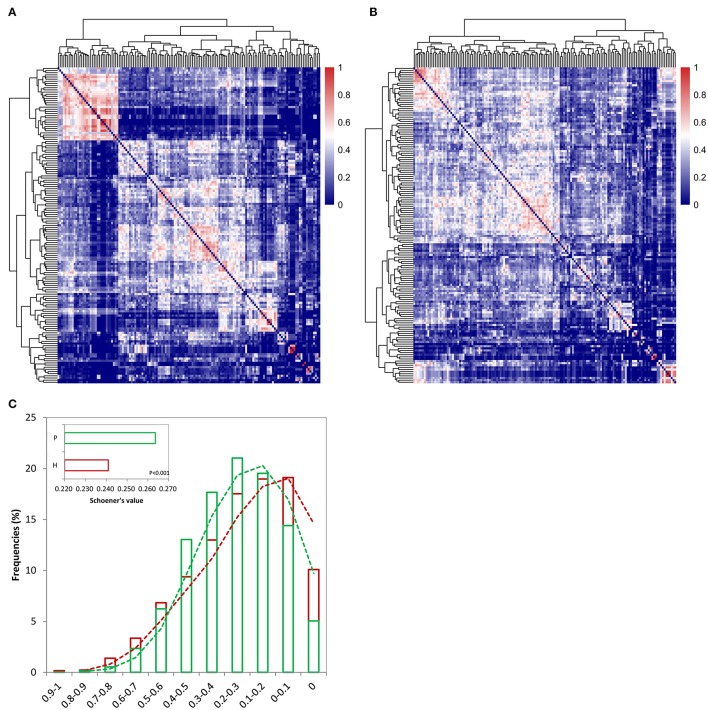
Heatmaps displaying genus distribution patterns for the healthy (A) and periodontitis (B) groups based on Schoener's index matrixes (Supplementary Tables 3, 4). Increasing values are translated into colors from blue to red. Trees were clustered based on the similarity of the Schoener's values. (C) The co-occurrence probabilities based on the Schoener's index were divided into 11 intervals, including 0, 0–0.1, 0.1–0.2, 0.2–0.3, 0.3–0.4, 0.4–0.5, 0.5–0.6, 0.6–0.7, 0.7–0.8, 0.8–0.9, and 0.9–1. The frequency of the Schoener's index falling into each interval was calculated in both the healthy (red) and periodontitis (green) groups. A global comparison of the Schoener's index between the two groups (using a t-test) is also shown within the plot.

