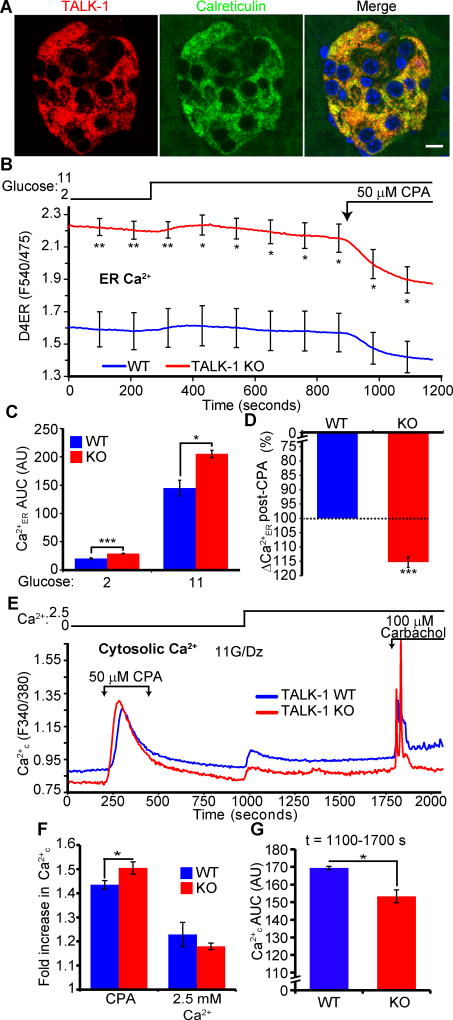
Figure 1. TALK-1 channels modulate β-cell Ca2+ER homeostasis.
(A) Representative images of a mouse pancreas section stained for TALK-1 and calreticulin. Scale bar is 10 µm. Images are representative of results obtained from 3 mice. (B) β-cell Ca2+ER measurements made with the genetically encoded Ca2+ER indicator D4ER. Cells were perfused with solutions containing indicated glucose concentrations and 50 µM CPA (N = 3 mice per genotype). (C) Area under the curve (AUC) analysis of Ca2+ER under low (2 mM) and high (11 mM) glucose conditions from (B). (D) CPA-induced reduction in Ca2+ER, presented as percent of maximum Ca2+ER of wild-type (WT) β-cells from (B). (E) WT and TALK-1 KO β-cells were perfused with the indicated solutions; 11 mM glucose (G) and 125 µM diazoxide (Dz) were present throughout the experiment. (F) Fold increase in Ca2+ in response to the indicated treatments. (G) Ca2+ AUC for the period following addition of 2.5 mM Ca2+ to the extracellular buffer (t=1000–1750 s) (N = 5 mice per genotype for E to G). Statistical significance was determined by Student’s t-test; *P<0.05, **P<0.01, ***P<0.005.

