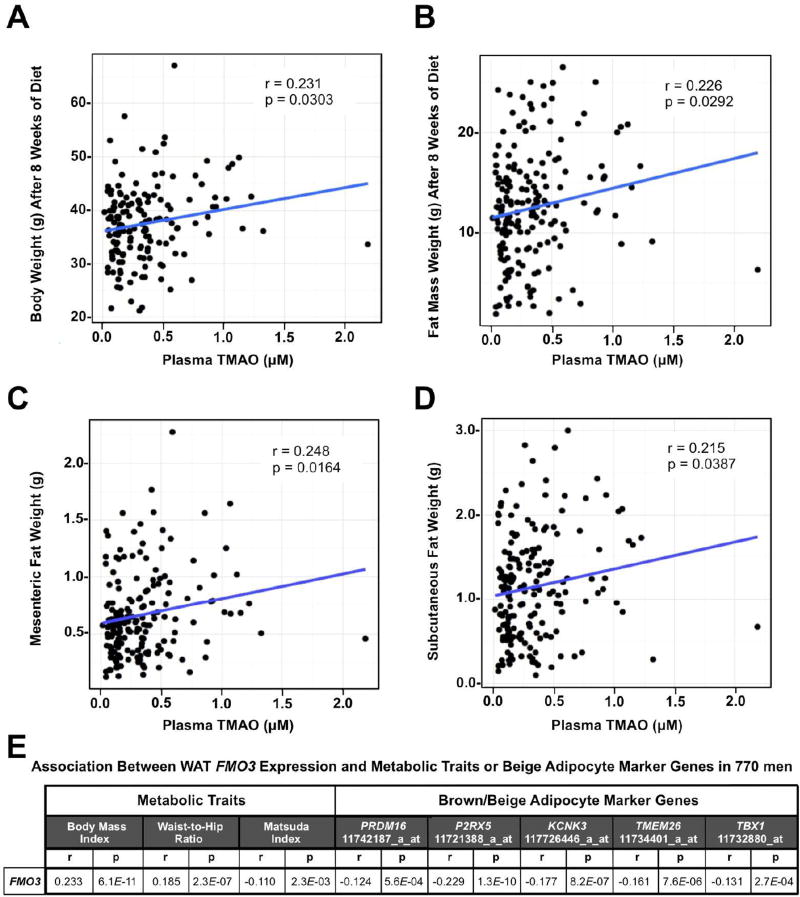
Figure 2. Plasma TMAO Levels in Mice and FMO3 mRNA Expression in Men Demonstrate Positive Correlations with Obesity.
(Panels A–D) Correlation of plasma trimethylamine-N-oxide (TMAO) levels with obesity-related traits in 180 male mice from 92 inbred strains within the hybrid mouse diversity panel (HMDP) after 8 week feeding of a high fat and high sucrose diet. Correlation coefficient (r) and p value (p) are indicated for each obesity trait.
(A) Correlation between plasma TMAO and body weight
(B) Correlation between plasma TMAO and fat mass
(C) Correlation between plasma TMAO and mesenteric fat weight
(D) Correlation between plasma TMAO and subcutaneous fat weight
(E) Correlations between human white adipose tissue flavin monooxygenase 3 (FMO3) mRNA expression and metabolic traits or brown/beige adipocyte marker gene expression (n=770). The gene name and probeset ID is provided for each of the brown/beige adipocyte marker genes.

