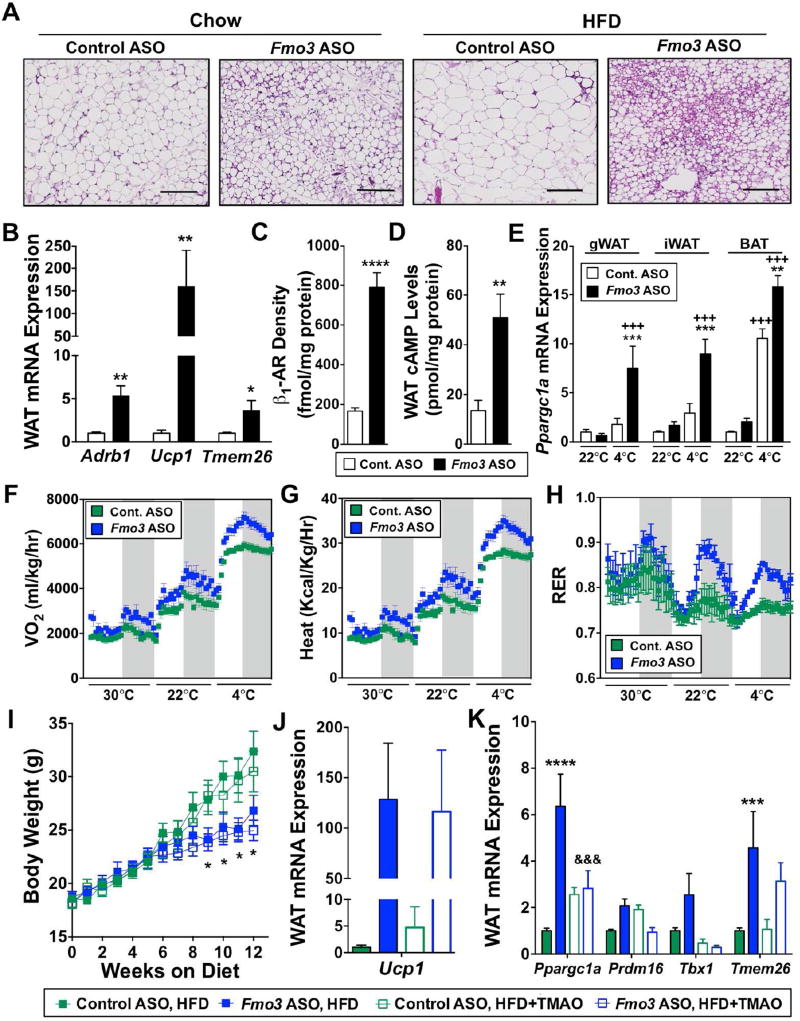
Figure 4. FMO3 Knockdown Stimulates the Beiging of White Adipose Tissue.
Panels (A–E) At 6–8 weeks of age, female C57BL/6 mice were treated with either a non-targeting control ASO or Fmo3 ASO in conjunction with high fat diet feeding (HFD) for 8–12 weeks.
(A) Microscopic examination of hematoxylin and eosin stained gonadal white adipose tissue; scale bar equals 200µm.
(B) Gonadal white adipose tissue (WAT) mRNA expression of β1-adrenergic receptor (Adrb1), uncoupling protein 1 (Ucp1), and transmembrane protein 26 (Tmem26) quantified by qPCR.
(C) Surface density of β1-adrenergic receptor (β1-AR) in gonadal white adipose tissue (WAT) quantified by radio-ligand binding assay.
(D) Cyclic AMP (cAMP) levels in gonadal white adipose tissue (WAT).
(E) Peroxisome proliferator-activated receptor gamma coactivator 1-alpha (Ppargc1a) mRNA expression was quantified by qPCR in gonadal (gWAT), inguinal (iWAT) and brown (BAT) adipose tissue.
Panels (F–H) Mice were housed in metabolic cages for indirect calorimetry measurements. Gray background denotes dark cycle.
(F) Oxygen consumption (VO2)
(G) Heat production
(H) Respiratory exchange ratio (RER)
Panels (I–K) At 6–8 weeks of age, female C57BL/6 mice were treated with either a non-targeting control ASO or Fmo3 ASO in conjunction with feeding of HFD or HFD supplemented with 0.02% w/w TMAO for 12 weeks. See also Figure S4.
(I) Body weight changes over 12 weeks
(J) Gonadal white adipose tissue (WAT) expression of uncoupling protein 1 (Ucp1)
(K) Gonadal white adipose tissue (WAT) expression of peroxisome proliferator-activated receptor gamma coactivator 1-alpha (Ppargc1a), PR domain-containing 16 (Prdm16), T-box transcription factor (Tbx1), and transmembrane protein 26 (Tmem26)
All data represent the mean ± S.E.M. for n=5–10 mice per group; *, p≤0.05, **, p≤0.01, ***, p≤0.001, ****, p≤0.0001 vs. control ASO-treated mice fed the same diet. +++, p≤0.001 vs. chow-fed mice treated with the same ASO. &&&, p≤0.001 vs. Fmo3 ASO-treated mice fed HFD.

