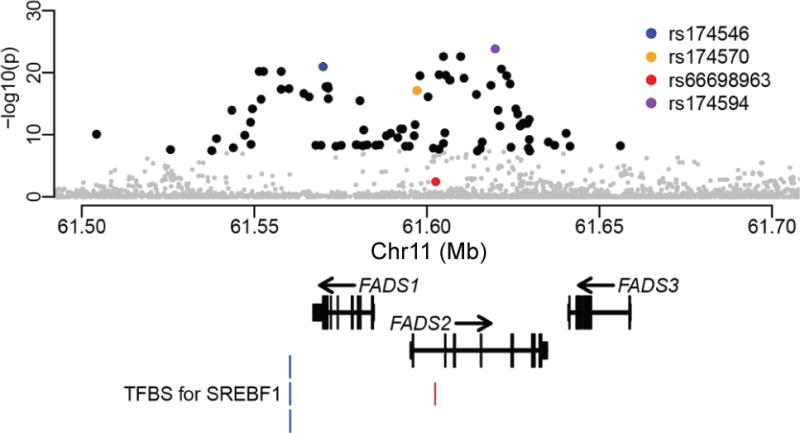
Fig. 1. Ancient DNA-based test for recent positive selection.

Each point represents a variant with its genomic location on the x-axis and its p value (genomic control corrected and at a negative logarithmic scale) on the y-axis. Four variants are highlighted: the most significant SNP (purple); the top SNP reported by Mathieson et al. based on the same test but without imputation12 (blue); one of the top adaptive SNPs reported in Greenlandic Inuit9 (orange); the adaptive indel reported in multiple populations with historical plant-based diets8 (red). Other variants are in black if exceeding the genome-wide significance level (5e-8), otherwise in gray. The overall pattern is consistent with that previously described12 (Supplementary Fig. 31). At the bottom of the plot are the representative transcript models for the three FADS genes and the four transcription factor binding sites for SREBF1 from ENCODE68 (blue) and another previous study11 (red).
