. 2017 Jun 5;5(1):2–6. doi: 10.1055/s-0037-1601405
This is an open-access article distributed under the terms of the Creative Commons Attribution-NonCommercial-NoDerivatives License, which permits unrestricted reproduction and distribution, for non-commercial purposes only; and use and reproduction, but not distribution, of adapted material for non-commercial purposes only, provided the original work is properly cited.
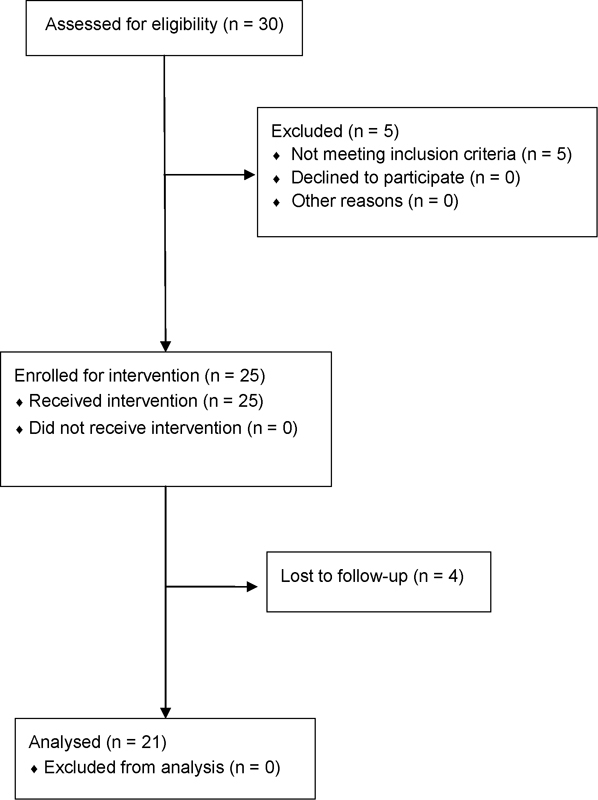
Fig. 1.

Flow diagram of the study.
