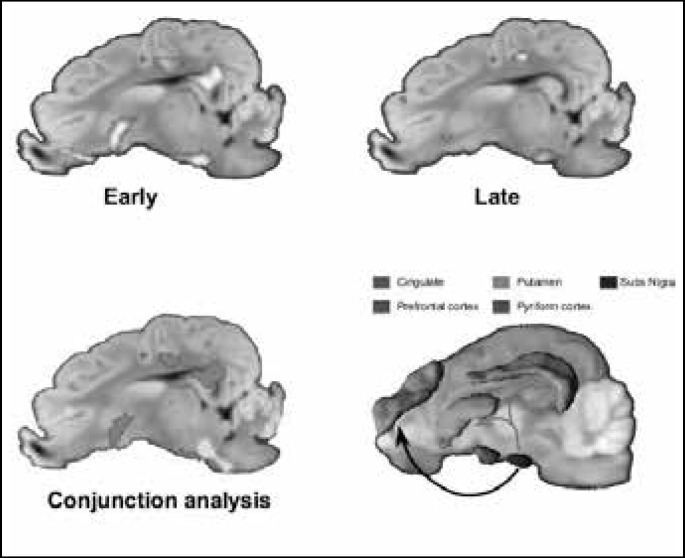
Fig. 1.
Top row: Statistical Tmaps (p = 0.005 corr, cluster size threshold 50 mm3) demonstrating positive activation for VNS versus sham group. Left image showed activations obtained after 10 days of stimulation (Early) whereas right image presented activations after 90 days of continuous stimulation (Late). Bottom left figure represented conjunction analysis for Early and Late conditions. Red areas were associated with the early condition whereas green ones were linked to late condition. Areas with overlapping colors were simultaneously activated in both conditions. Bottom right figure represented the brain network involved. Black arrow – transthalamic substance nigra – prefrontal network

