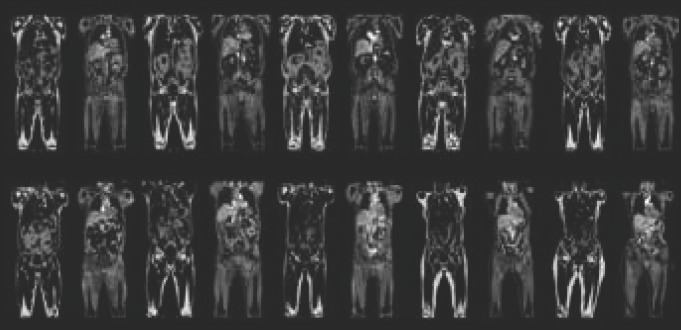
Fig. 1.
Central coronal slices from 10 of the imaged subjects, demonstrating the wide range of phenotypes within the UK Biobank imaging study. For each subject; left shows intensity-corrected coronal fat image with fat segmentations using overlay colours, right shows intensity-corrected coronal water image with muscle segmentations using overlay colours.

