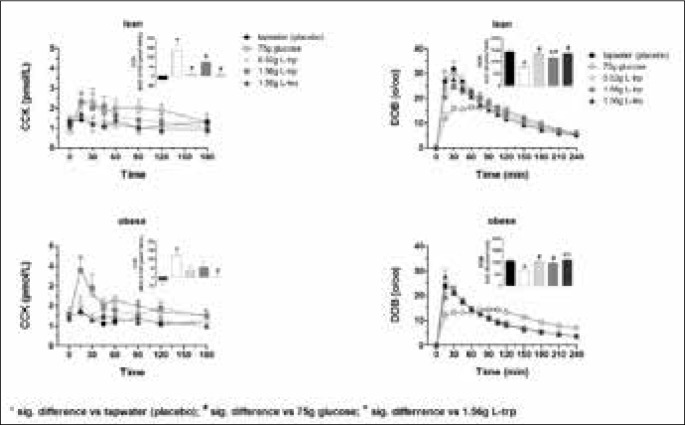
Fig. 1.
Plasma CCK concentrations and gastric emptying rates
Plasma CCK concentrations and gastric emptying rates in response to intragastric loads of 0.52 g L-trp, 1.56 g L-trp, 1.56 g L-leu and 75 g glucose in lean and obese subjects. Placebo treatment is 300 mL tap water. AUC, area under the concentration-time curve; DOB, delta over basal. Data are expressed as mean ± SEM. *, p ≤ 0.05, statistically significant difference vs. tap water. #, p ≤ 0.05, statistically significant difference vs. 75 g glucose. +, p ≤ 0.05, statistically significant difference vs. 1.56 g L-trp. N = 10 lean (5 men and 5 women) and 10 obese (5 men and 5 women).

