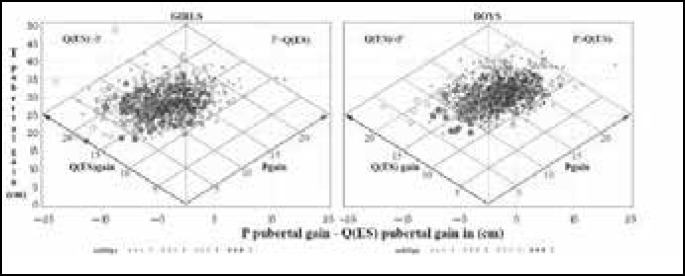
Abb. 1.
The pubertal height gain divided to the specific pubertal (P) gain and the ongoing continuous Q(ES)-function
The increase in height during puberty is divided to the specific pubertal gain from the P-function (Pgain) and the ongoing continuous Q(ES)-function (Q(ES)gain) from the QEPS-model, girls, left, boys, right. The pubertal gain is expressed as a subtraction on the horizontal axis and total pubertal gain (T pubertal gain) on the vertical axis. The total pubertal gain can be evaluated using the transverse lines for each variable. The oblique blue line, with its transverse blue isolines, represents Q(ES) pubertal gain, and the oblique red line, with its transverse isoline, represents Pgain. The different symbols represent each individual with childhood BMI-SDS of; normal weight (blue open circles), underweight (blue crosses), overweight (red open circles) and obesity (red filled circles).

