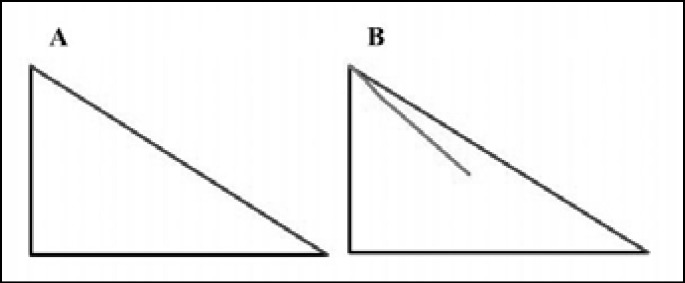
Fig. 1.
Representation of graphics seen on Mandometer screen during training. A-blue training line presented to user to follow while eating. B-red line develops as food is consumed. In this case, food is being consumed too quickly and the computer would encourage user to eat a little slower to approximate red line to training line.

