. 2016 May 25;9(Suppl 1):1–376. doi: 10.1159/000446744
Copyright © 2016 by S. Karger GmbH, Freiburg
This article is licensed under the Creative Commons Attribution-NonCommercial-NoDerivatives 4.0 International License (CC BY-NC-ND) (http://www.karger.com/Services/OpenAccessLicense). Usage and distribution for commercial purposes as well as any distribution of modified material requires written permission.
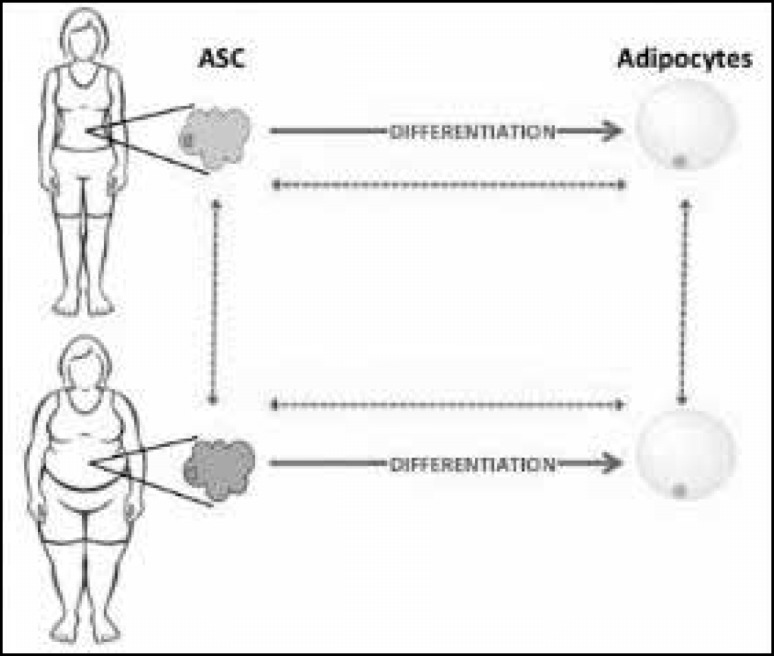
Fig. 1.

Graphical approach of the 4 group of samples studied.
