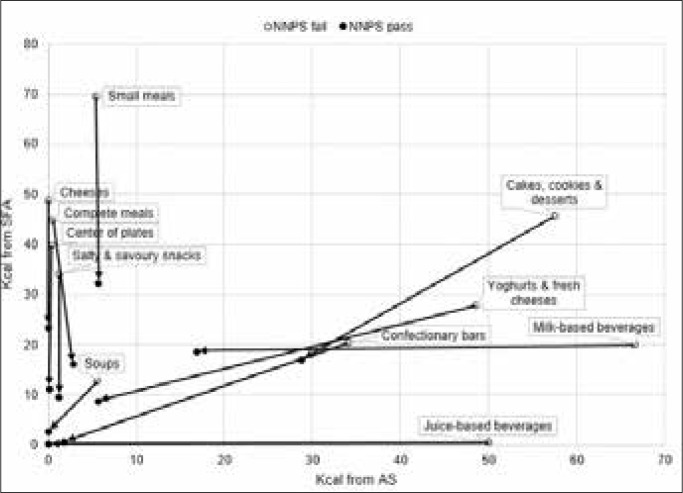
Fig. 2.
Average amount of energy coming from added sugars (x-axis) and saturated fatty acids (y-axis), for 11 NNPS product categories (French INCA2 data).
The start of the arrow represents the average nutrient composition of NNPS Fail products (○), the arrow points towards the composition of NNPS Pass products (•).

