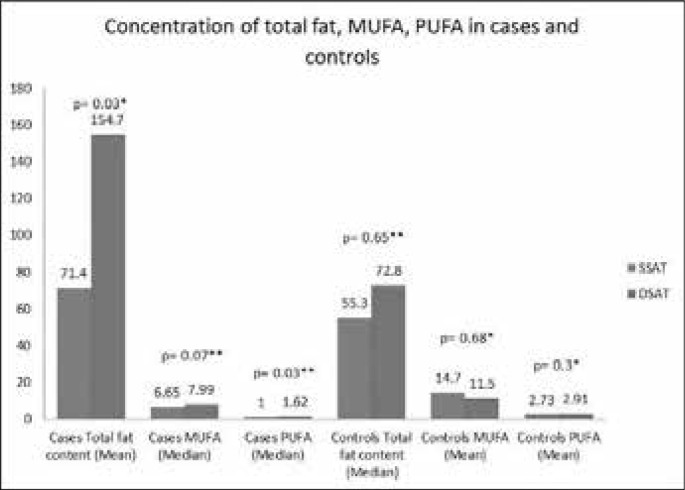
Fig. 1.
Bar diagram depicting concentrations of total fat, MUFA and PUFA among cases and controls in SSAT and DSAT
The respective p values are depicted above the graphs. Among cases, there is significantly higher total fat and PUFA content in the DSAT than SSAT. (SSAT= Superficial subcutaneous adipose tissue, DSAT= deep subcutaneous adipose tissue, PUFA= poly unsaturated fatty acid, MUFA= mono unsaturated fatty acid, *p value by paired t test, **p value by Wilcoxon signed ranks test)

