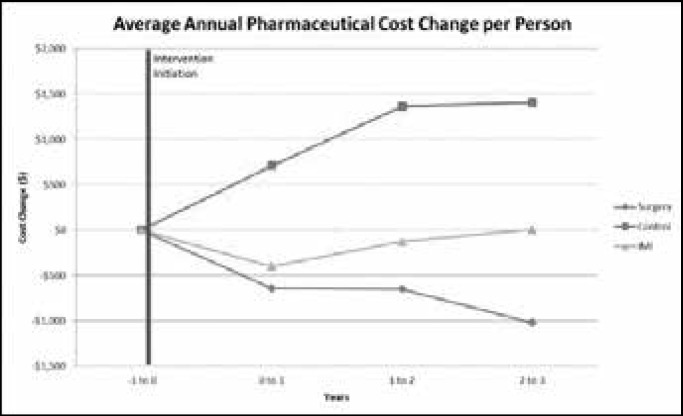
Fig. 1.
Average Annual Pharmaceutical Cost Change per person Using an average baseline cost for all groups the figure displays the average annual cost change per person from baseline to years one, two and three post treatment for surgical and IMI groups and also displays the pharmacy cost changes of controls for comparison

