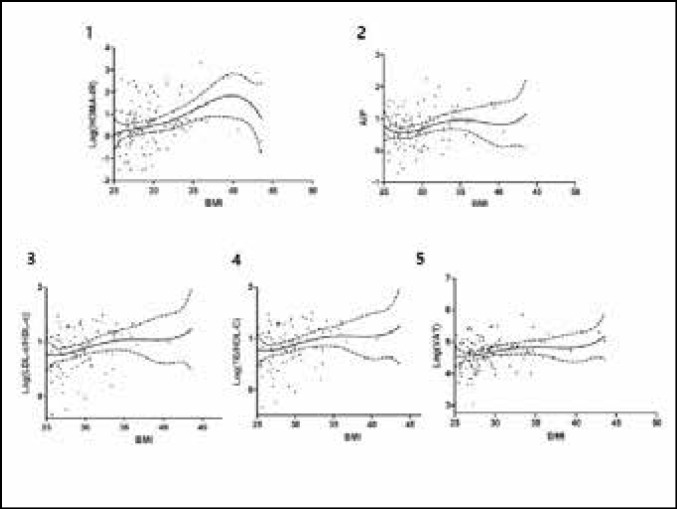
Fig. 1.
Scatter plots and nonlinear regression curves showing relations between BMI and cardiometabolic risk factors.
Solid line, nonlinear regression curve; dotted line, 95% confidence band. BMI, body mass index; HOMA-IR, homeostatic model assessment – insulin resistance; AIP, atherogenic index of plasma; TG, triglyceride; HDL-C, high density lipoprotein-cholesterol; TC, total cholesterol; LDL-C, low density lipoprotein- cholesterol; VAT, visceral adipose tissue.

