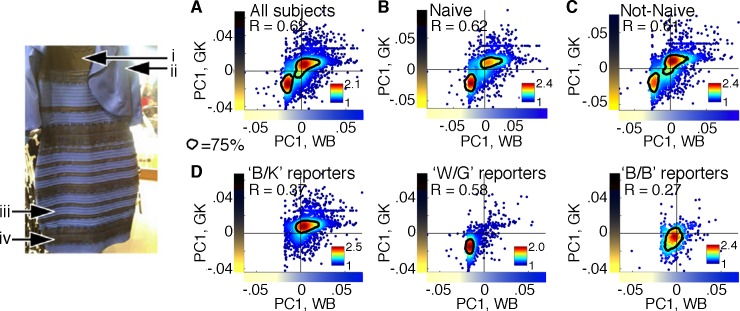
Figure 1.
Population distributions of subjects' color matches show categorical perception of the dress. Subjects used a digital color picker to match their perception of four regions of the dress (i, ii, iii, iv); the dress image was shown throughout the color-matching procedure. (A) Matches for regions i and iv of the dress plotted against matches for regions ii and iii, for all online subjects (N = 2,200; R = 0.62, p < 0.001). Contours contain the highest density (75%) of matches. The first principal component of the population matches (computed from CIELUV values) to (i, iv) defined the y-axis (gold/black: GK); the first principal component of the population matches to (ii, iii) defined the x-axis (white/blue: WB). Each subject's (x, y) values are the principal-component weights for their matches; each has two (x, y) pairs, corresponding to (i, ii) and (iii, iv). Color scale is number of matches (smoothed). (B) Color matches for regions (i, iii) of the dress plotted against matches for regions (ii, iv) for subjects who had never seen the dress before the experiment (Naïve; N = 1,017; R = 0.62, p < 0.001). Axes and contours were defined using data from only those subjects. (C) Color matches for regions (i, iv) of the dress plotted against matches for regions (ii, iii) for subjects who had seen the dress before the experiment (N = 1,183; R = 0.61, p < 0.001). Axes and contours were defined using data from only those subjects. (D) Color matches for all subjects (from A) were sorted by subjects' verbal color descriptions (“blue/black” = B/K, N = 1,184; “white/gold” = W/G, N = 686; “blue/brown” = B/B, N = 272) and plotted separately. Axes defined as in (A). In all panels, contours contain the highest density (75%) of the matches shown in each plot. Dress image reproduced with permission from Cecilia Bleasdale.

