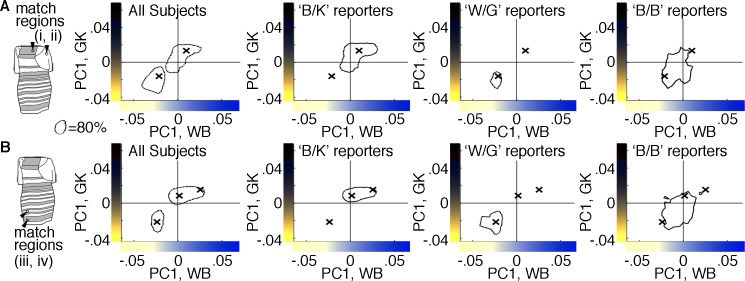
Figure 3.
Comparison of color-matching data (contours) with predictions from the k-means clustering solutions (x), sorted by subjects' verbal reports. Color-matching distribution contours and k-means cluster centroids derived from independent data sets for (A) the color matches made to upper regions of the dress (region i is plotted against region ii; principal-component analysis weights and principal-component axes from Figure 1A) and (B) lower regions of the dress (iv, iii). Distribution contours were determined using one half of the data set (randomly sampled from the online subject pool); cluster centroids were determined using the left-out data (clustered using the optimal k identified in the gap analysis from Figure 2). Individual plots show the contours encompassing the top 80% of color matches for half the data from each group (left to right): all subjects; subjects who described the dress as blue and black (B/K); subjects who described the dress as white and gold (W/G); and subjects who described the dress as blue and brown (B/B). Within each row, the same cluster centroids are replotted across the panels, reflecting the outcome of clustering the unsorted data set (i.e., independent of verbal reports).

