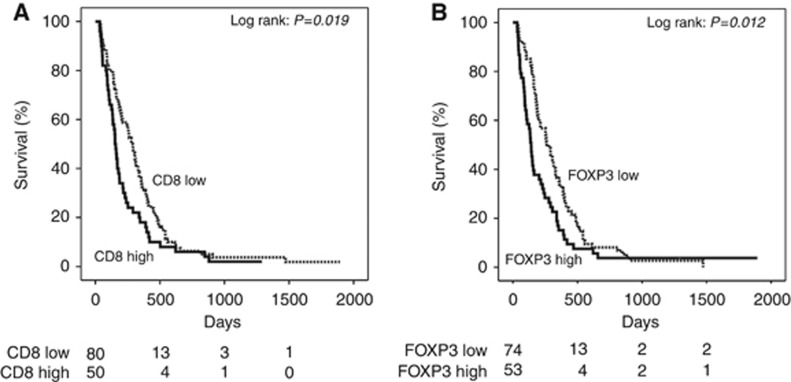
Figure 3.
Kaplan–Meier survival curves of adaptive immune markers associated with survival in non-epithelioid mesothelioma. (A) Kaplan–Meier curves for non-epithelioid mesothelioma survival according to CD8+ T-cell counts (log-rank test, P=0.019). (B) Kaplan–Meier curves for non-epithelioid mesothelioma survival according to FOXP3+ T-regulatory cell counts (log-rank test, P=0.012).

