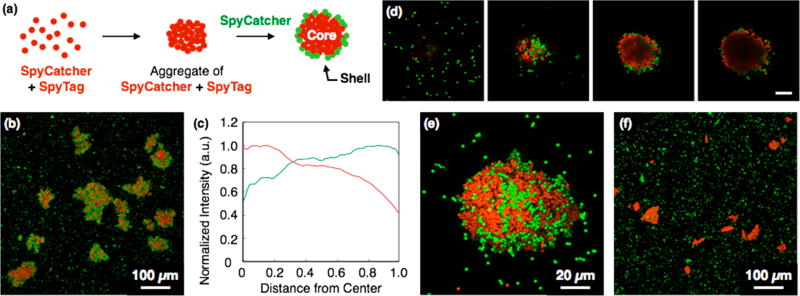
Figure 5.
(a) Schematic illustration of formation of core–shell architecture. (b) Core–shell structure formed by SpyTag- and SpyCatcher-functionalized particles. SpyCatcher-coated particles (green) were added to the aggregates of SpyTag- and SpyCatcher-functionalized particles (red) in PBS with 0.005% tween 20 at 25 °C. (c) Fluorescence intensity of core–shell structure shown in (b), plotted against the distance from center of the aggregates. (d) Z-stack of magnified images of core–shell structure formed by SpyTag and SpyCatcher. Images are shown with 3.87 μm slice spacing. Total thickness: 11.6 μm. Scale bar: 20 μm. (e) Orthogonal projection image of (d). (f) Control experiment for core–shell formation. E-functionalized particles (green) were added to the aggregates of SpyTag- and SpyCatcher-functionalized particles (red).

