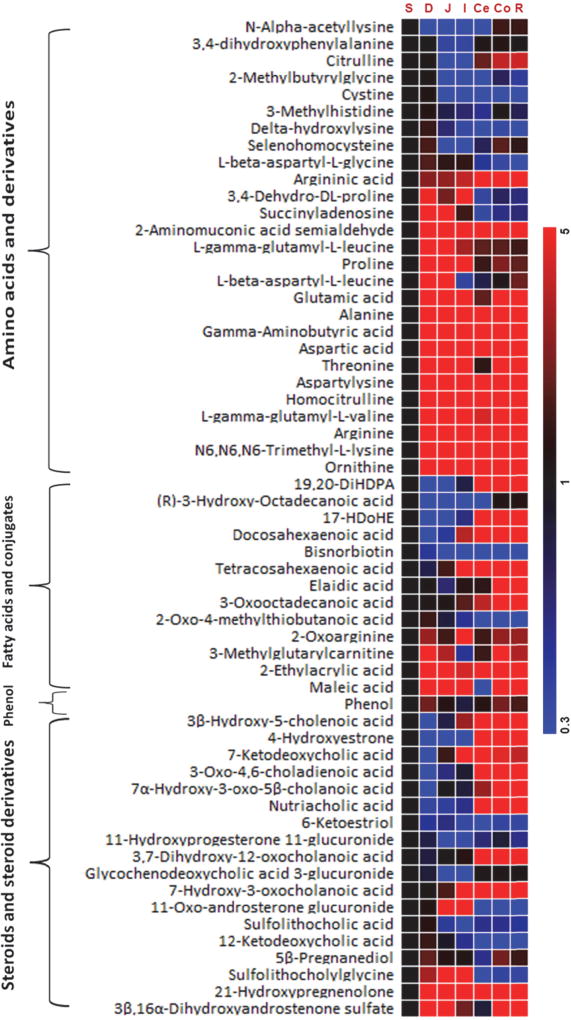
Figure 2.
Heatmap of the representative intestinal content metabolites in control rats. Heatmap shows changes in metabolites compared to stomach at stomach, duodenum, jejunum, ileum, cecum, colon and rectum. Shades of red and blue represent fold increase and fold decrease of a metabolite, respectively, in duodenum, jejunum, ileum, cecum, colon and rectum relative to stomach (see color scale). Each cell in the heatmap represents the fold change of a particular metabolite, which is the ratio of the concentration in the contents of duodenum, jejunum, ileum, cecum, colon or rectum to that in the stomach.
* S, stomach; D, Duodenum; J, Jejunum; I, Ileum; Ce, Cecum; Co, Colon; R, Rectum

