
Figure 2. LFA-1 Maintains Tfh Cells within the GC Niche by Limiting Apoptosis.
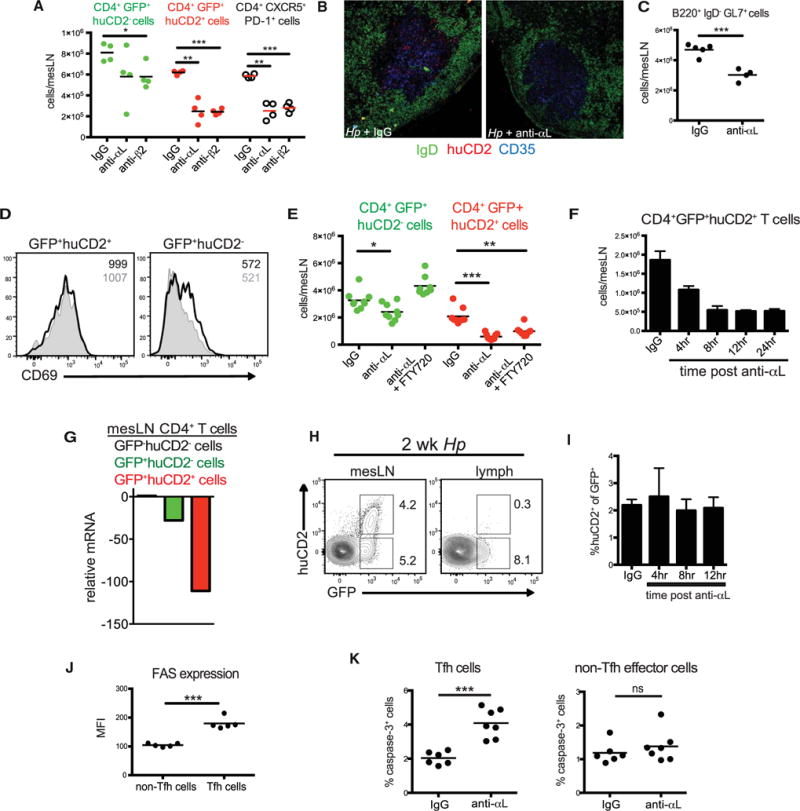
(A–D) 4get/KN2 mice were infected with Hp and administered anti-αL, anti-β2, or Rat IgG blocking antibodies i.p. at 2 weeks post-infection. mLNs were harvested 24 hr after antibody treatment and assessed by flow cytometry or confocal microscopy. (A) The number of GFP+huCD2−, GFP+huCD2+, and CXCR5+PD-1+ CD4+B220−mLN cells. (B) Immunofluorescent images of mLN sections stained with GL7 (green), huCD2 (red), and CD35 (blue). (C) The number of B220+ GL7+IgD−mLN cells 24 hr after anti-αL treatment. (D) Representative histograms of CD69 expression of the GFP+huCD2−and GFP+huCD2+ CD4+ mLN cell populations from rat IgG (unshaded histogram) or anti-αL (shaded histogram) treated 4get/KN2 mice 24 hr after treatment. Inset numbers represent MFI.
(E) The number of GFP−CD62L+, GFP+huCD2−, and GFP+huCD2+ CD4+ mLN cells from infected 4get/KN2 mice 24 hr after treatment with FTY720, anti-αL, or both. Rat IgG was used as a control.
(F) Total cell counts of GFP+huCD2+ CD4+ mLN cells at the indicated time points post-administration of αL antibody to 2 week Hp-infected 4get/KN2 mice.
(G) Expression of S1p1 mRNA in GFP+huCD2−and GFP+huCD2+ mLN CD4+ T cell populations sorted from 2 week Hp infected 4get/KN2 mice relative to the GFP−huCD2−population.
(H) Representative contour plots gated on CD4+B220−cells from the mesenteric lymph node and mesenteric efferent lymphoid vessels of 2 week Hp infected 4get/KN2 mice. Numbers represent frequency of the gated subset from the total CD4+ population. (I) Frequency of huCD2+ cells from the total GFP+CD4+ cell population from the mesenteric efferent lymph at various time points following αL integrin blockade of 2 week Hp-infected 4get/KN2 mice.
(J) Fas expression (MFI) by Tfh (CD4+B220−CD62L−CD44+CXCR5+huCD2+) and non-Tfh effector cells (CD4+B220−CD62L−CD44+CXCR5−huCD2−) from the mLNs of 4get/KN2 mice 8 hr post αL blockade.
(K) Frequency of active caspase-3+ Tfh (CD4+B220−CD62L−CD44+CXCR5+huCD2+ or CD4+B220−CD62L−CD44+CXCR5+PD-1+) and non-Tfh effector cells (CD4+B220−CD62L−CD44+CXCR5−huCD2−or CD4+B220−CD62L−CD44+CXCR5−PD−1−) from the mLNs of 4get/KN2 mice 8 hr post αL blockade. Dots in graphs represent individual mice.
(A)–(J) are representative of at least two independent experiments and (K) shows representative data compiled from four independent experiments. ***p < 0.001, **p < 0.01, and *p < 0.05. Error bars, SD ns, not significant. See also Figure S1.