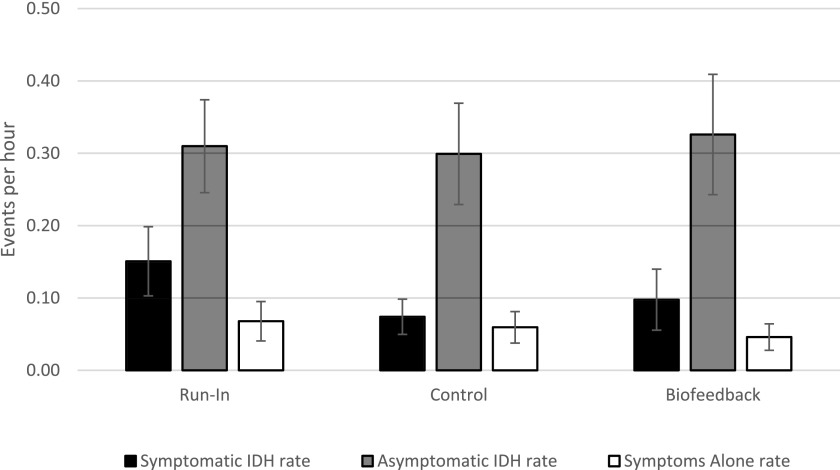
Figure 4.
The results of the analysis for rates of symptomatic IDH, asymptomatic IDH, and symptoms alone remained consistent with the primary analysis. Symptomatic IDH rate did not differ between the run-in and the biofeedback period (P=0.12), but decreased between the run-in and the control period (P=0.01). There was no difference between the biofeedback and the control period (P=0.29). Asymptomatic IDH rate did not differ between the run-in and the biofeedback period (P=0.77) or the run-in and the control period (P=0.83); there were no differences between the biofeedback and the control period (P=0.64). Symptoms alone rate did not differ between the run-in and the biofeedback period (P=0.20) or the run-in and the control period (P=0.64); there were no differences between the biofeedback and the control period (P=0.37). IDH, intradialytic hypotension.

