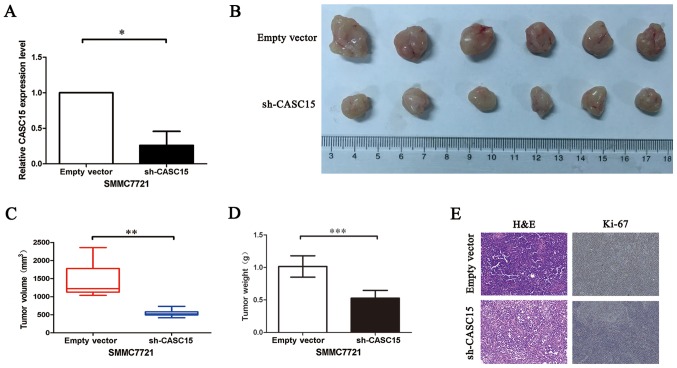
Figure 6.
The effects of CASC15 knockdown on tumor growth in vivo. (A) The CASC15 expression level was determined by reverse-transcription quantitative polymerase chain reaction after transfection of SMMC7721 cells with sh-CASC15. (B) Tumors from the nodes of mice 21 days after injection of SMMC7721 cells stably transfected with sh-CASC15 or empty vector. (C) The tumor volumes are expressed as means ± SD. (D) The tumor weights are expressed as means ± SD. (E) Representative image of immunohistochemical staining of the tumor. The sh-CASC15 group showed lower Ki-67 protein levels compared with the control. Left, hematoxylin and eosin staining. Right, immunostaining. The abbreviations are the same as in Fig. 1. *P<0.05, **P<0.01, ***P<0.001. Magnification, ×100.

