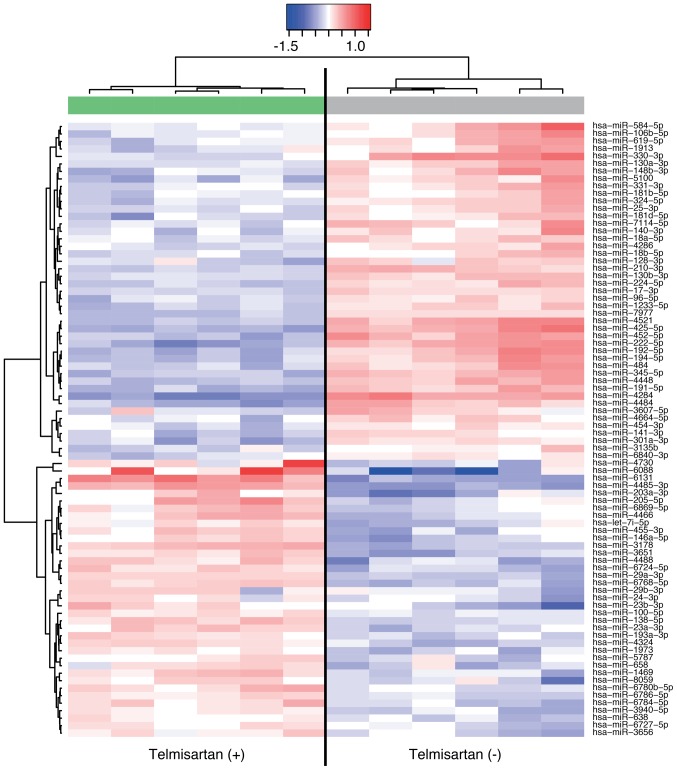
Figure 6.
Hierarchical clustering of HuCCT-1 cells cultured with or without telmisartan. The analyzed samples are noted in the columns, and the miRNAs are presented in the rows. The miRNA clustering color scale presented at the top indicates relative miRNA expression levels, with red and blue representing high and low expression levels, respectively.

