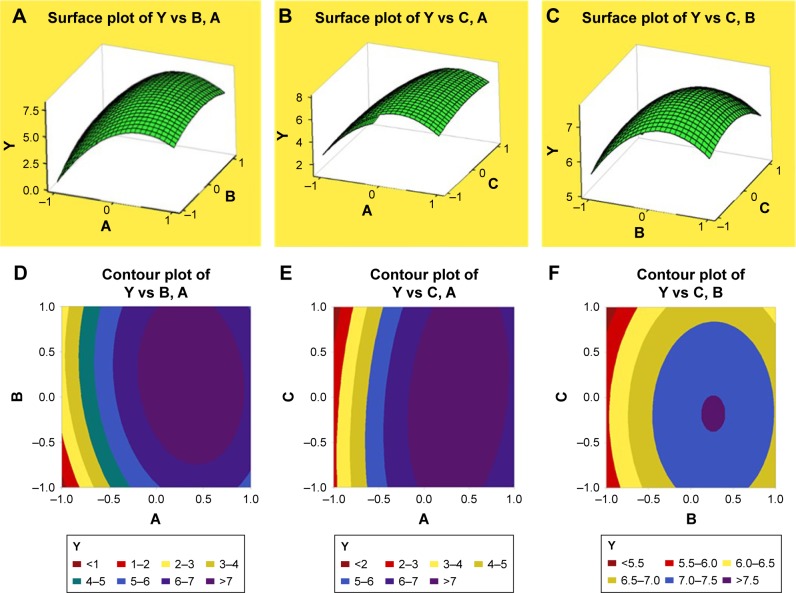
Figure 1.
Three-dimensional response surface plots and contour plots for Y as a function of two of three variables at a fixed value of the third one variable.
Notes: Response surface plot for Y as a function of (A) polymer concentration and volume ratios of oil phase to water phase at fixed emulsifier concentration, (B) polymer concentration and emulsifier concentration at fixed volume ratios of oil phase to water phase, (C) volume ratios of oil phase to water phase and emulsifier concentration at fixed polymer concentration, (D–F) contour plots for Y as a function of two of three variables at a fixed value of the third one variable as (A–C). Y is drug loading (%), and A, B and C are coded values for polymer concentration (%), oil phase:water phase (V/V), and emulsifier concentration (%), respectively.

