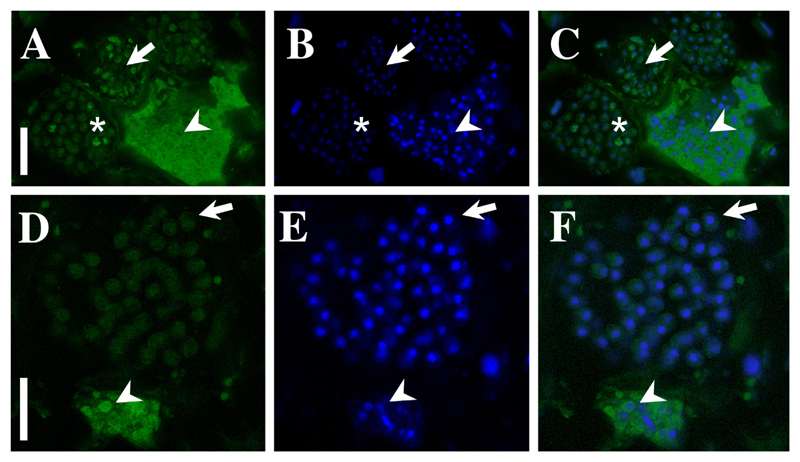
Figure 4.
FISH-staining of the 28S rDNA region of M. braseltonii. A–C: FISH signal (A), DAPI staining (B) and an overlay of both channels (C) showing a multinucleate plasmodium (arrowhead) and developing resting spores (arrow). The brighter colouration of the plasmodium indicates a high physiological activity in the growing plasmodia. The DNA is arranged differently in plasmodia and the spores as DAPI staining shows longish-irregular, dividing nuclei in the plasmodium (arrowhead) and a condensed nucleus in the resting spores (arrow). The asterisk is highlighting a just forming resting spore which can be identified by the strong FISH-signal around the edges and the not well visible nuclei in DAPI staining. Scale bar = 20 μm. D–F: FISH signal (D), DAPI staining (E) and an overlay of both channels (F) showing a multinucleate plasmodium (arrowhead) and developing resting spores (arrow). The plasmodium is very mature as the ribosomes aggregate in the form of the resting spores (arrowhead) while the resting spores in this image are fully mature as inferred from the shape of the nucleus and the weaker ribosomal FISH signal (arrow). Scale bar = 15 μm.

