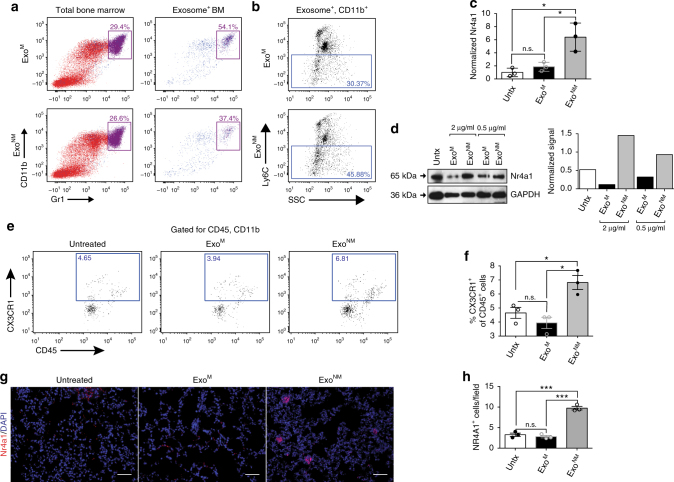
Fig. 2.
ExoNM increase PMo population. C57BL/6 mice were treated with ExoM or ExoNM, prior to BM isolation. a Flow cytometry shows the uptake of fluorophore-tagged exosomes by the myeloid cells in the BM. Left: Flow plots of the total CD11b+Gr1+ BM populations. Right: Plots show a higher percentage of CD11b+Gr1+ cells among the BM cells positive for exosome uptake. A representative of three independent experiments is shown. b Treatment with ExoNM leads to an increase in Ly6ClowCD11b+ cells compared to ExoM in the total myeloid population. c qRT-PCR of mRNA encoding Nr4a1. Mouse BM monocytes were treated 24 h with exosomes (10 μg ml−1). The experiment was performed in biological triplicates and technical replicates of two. *P < 0.05 by t-test in pairwise comparisons. Averages and s.d. values shown. d Western blot shows an increase in Nr4a1 in mouse BM monocytes treated with ExoNM. Quantification was performed using ImageJ (National Institutes of Health), utilizing plot profile (areas under the peaks) and integrated density measures. A representative of three experiments is shown. e–h Exosomes increase the presence of PMo in the lung. C57BL/6 mice were treated with 10 μg ExoNM or ExoM 72 and 24 h prior to sacrifice. CX3CR1+ cells present in the lung were detected by FACS or in situ IF. e Mouse lungs were lavaged, smashed through a strainer and single-cell suspension stained for CD11b, CD45, and CX3CR1. FACS plots were gated for CD11b+CD45+ cells and CX3CR1+ cells quantified. f Quantification of the data shown in a (percent CX3CR1+of total CD45+ cells). *P < 0.05 calculated as above. Mean and s.d. values are shown. g IF analysis shows the increased abundance of Nr4a1+ cells in the lungs of mice treated with ExoNM. Scale bar, 100 μm. h Quantification of the data in g, expressed as number of Nr4a1+ cells field−1. Scale bar: 50 μm. n = 3 mice per group, five images per section. *P < 0.05, **P < 0.001, and ***P < 0.0005 by pairwise two-tailed t-test; n = 5 mice per group, >5 random images per lung. Mean and s.d. values are shown

