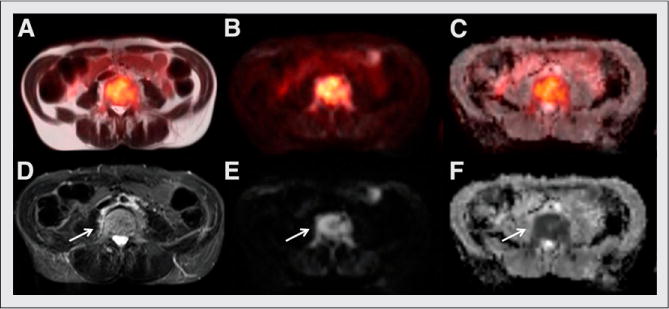
FIGURE 2.

Axial MR and fused PET/MR images show active site of MM involvement in lumbar vertebral body (arrows): fused single-shot turbo spin echo T2-weighted MRI (A), fused DWI PET (B), fused ADC map PET (C), fat-suppressed turbo spin echo T2-weighted MRI (D), DWI (E), and ADC (F). Bright signal intensity is seen on T2-weighted and diffusion images, with corresponding dark signal intensity on ADC denoting restriction in diffusion—a correlate for increased cellular density. (Images obtained on Washington University clinical PET/MR scanner.)
